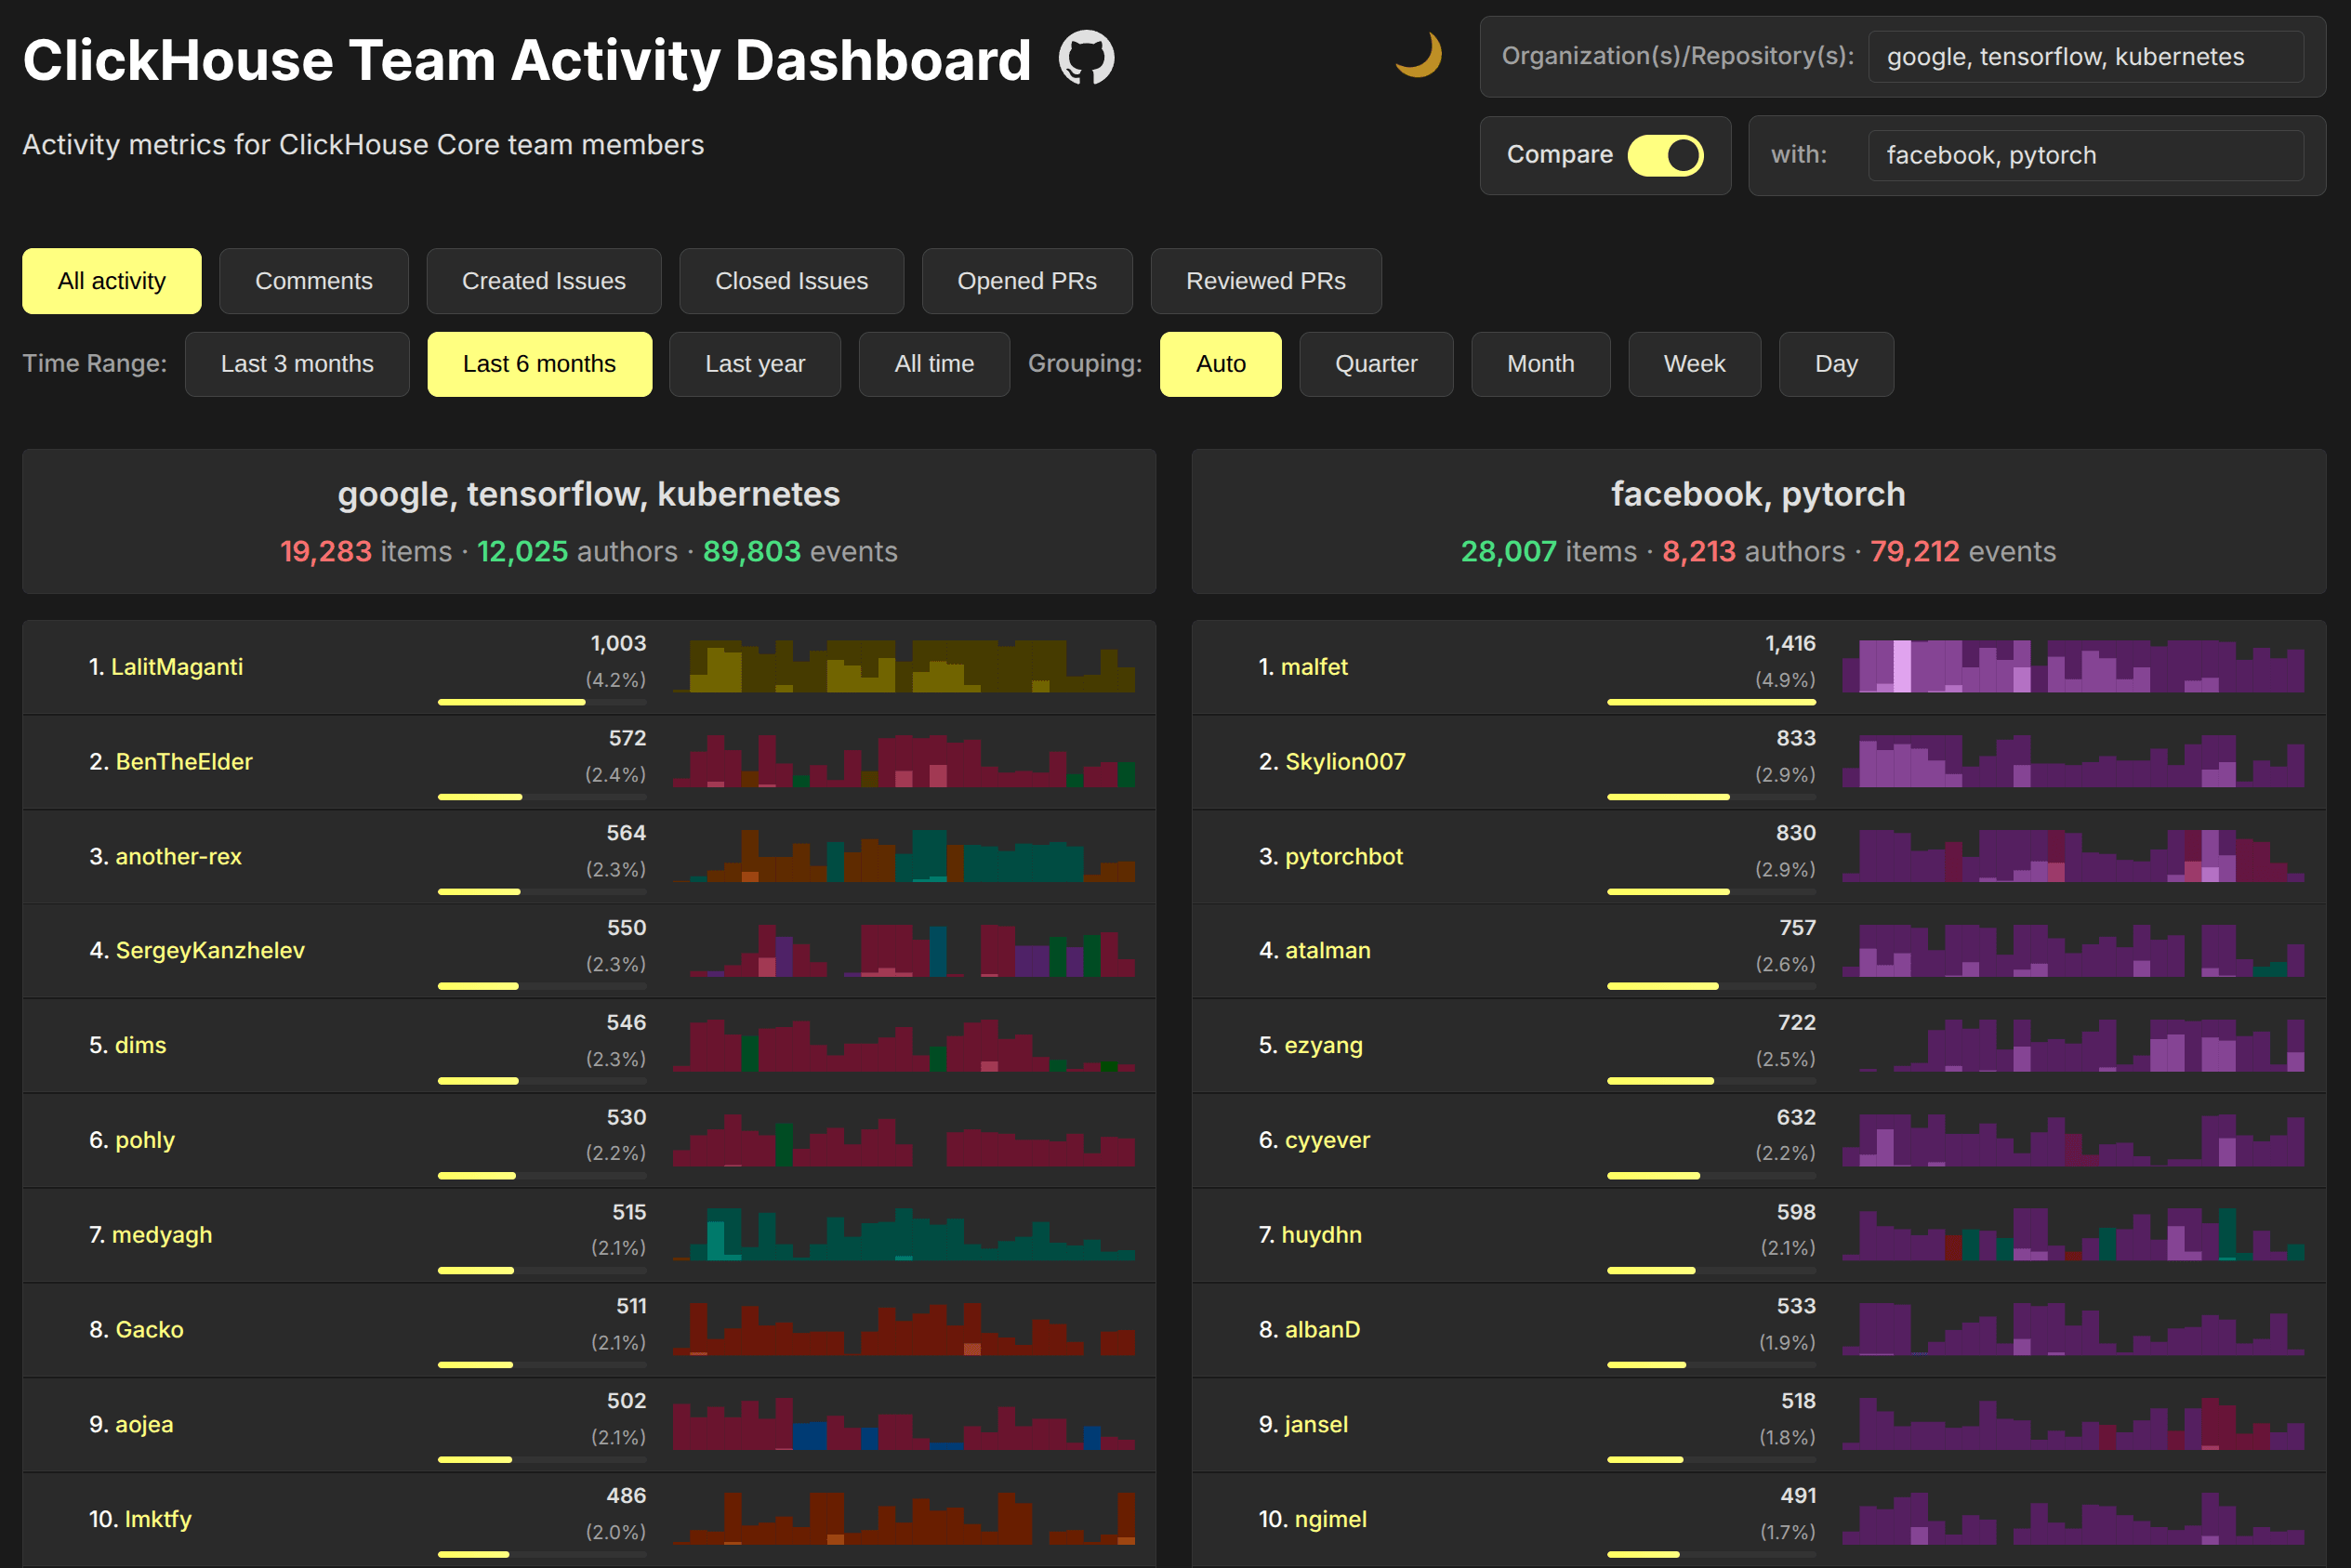
Initially, I wanted to make a single report to incentivise our managers for looking at and resolving GitHub issues. But I'm greedy, so in the end it appeared to be a website where you can compare various metrics on team activities across GitHub repositories. Check it here.
This is wrong #
Developer productivity metrics are a problematic topic. I hope no one compares committed lines of code today. However, if you track something like the number of commits and pull requests, you make the same mistake. Neither commits nor pull requests are the primary activities of the company, and neither the number of such items provides reliable information about the amount of work by particular individuals.
It could be nice to check the metrics out of curiosity, to find general trends on a large scale, but the metrics should not be a primary target for optimization. They could only be used as a secondary signal.
It makes sense anyway #
The metrics of your own team are always wrong! So I added the possibility to calculate and compare any repositories and organizations on GitHub.
Examples:
Rust vs. Zig | Polars vs. Datafusion | Superset vs. Metabase | Node vs. Deno | Node vs. Bun | SurrealDB vs ArangoDB | Elasticsearch vs Opensearch | Redis vs. Valkey | Tensorflow vs. PyTorch | QDrant vs. Weaviate | Supabase vs. Neon
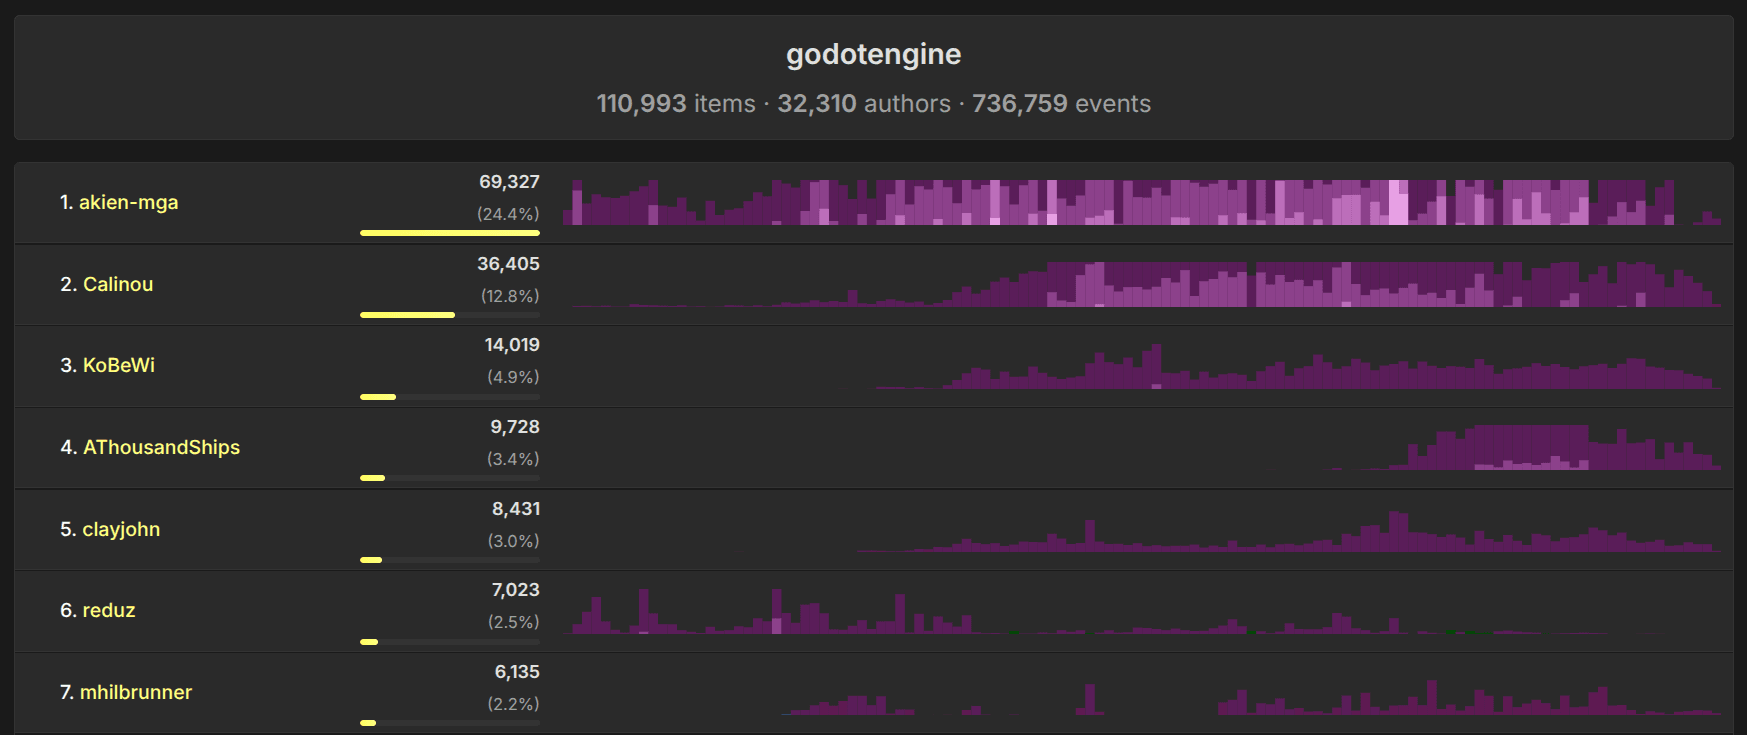
We can see when particular people started and stopped contributing to the project, what the distribution of the community size is, and what the general trends are in a specific repository's activity. The popularity of a project can be estimated by the number of GitHub issues (meaning, feature requests, bug reports, and questions).
Keep in mind that direct comparison is not always possible and can be misleading. For example, Spark and MongoDB don't use GitHub issues, forcing their users to register in Jira. Linux kernel uses neither issues nor pull requests. LLVM has recently migrated from Phabricator and Bugzilla to GitHub pull requests and issues, which made it way more accessible, while GCC is only available on GitHub as a mirror. Chromium also does not use issues or pull requests. For established open-source products, it's more an exception than the rule to use GitHub for issue tracking.
Implementation #
The website is implemented as a single-page HTML application, connecting directly to the ClickHouse database. It runs SQL queries from a read-only user, configured with limits and quotas. The database design and data collection are described in this article from 2020.
It has a few neat details in the UX.
In the repository selector, you can type organizations (like ClickHouse), single repositories (like ClickHouse/ClickHouse), or use wildcards (like apache/superset*), as well as list multiple items. It will show suggestions by substring search across all GitHub repositories, sorted by the number of stars.
For the charts, we use the "horizon chart" type, which allows a high information density in a narrow space. We also highlight activity on different repositories with different colors, so you can see, for example, when I was contributing to ClickHouse and when I was contributing to ClickBench.
In the list of authors, you can click on anyone to see the list of all activities in the ClickHouse SQL UI, and if you click on a single data point on the chart, you can dig into the events for the corresponding time. You can also remove any author from the report to clean it of automations or spam activity.
The source code is available here.
Results #
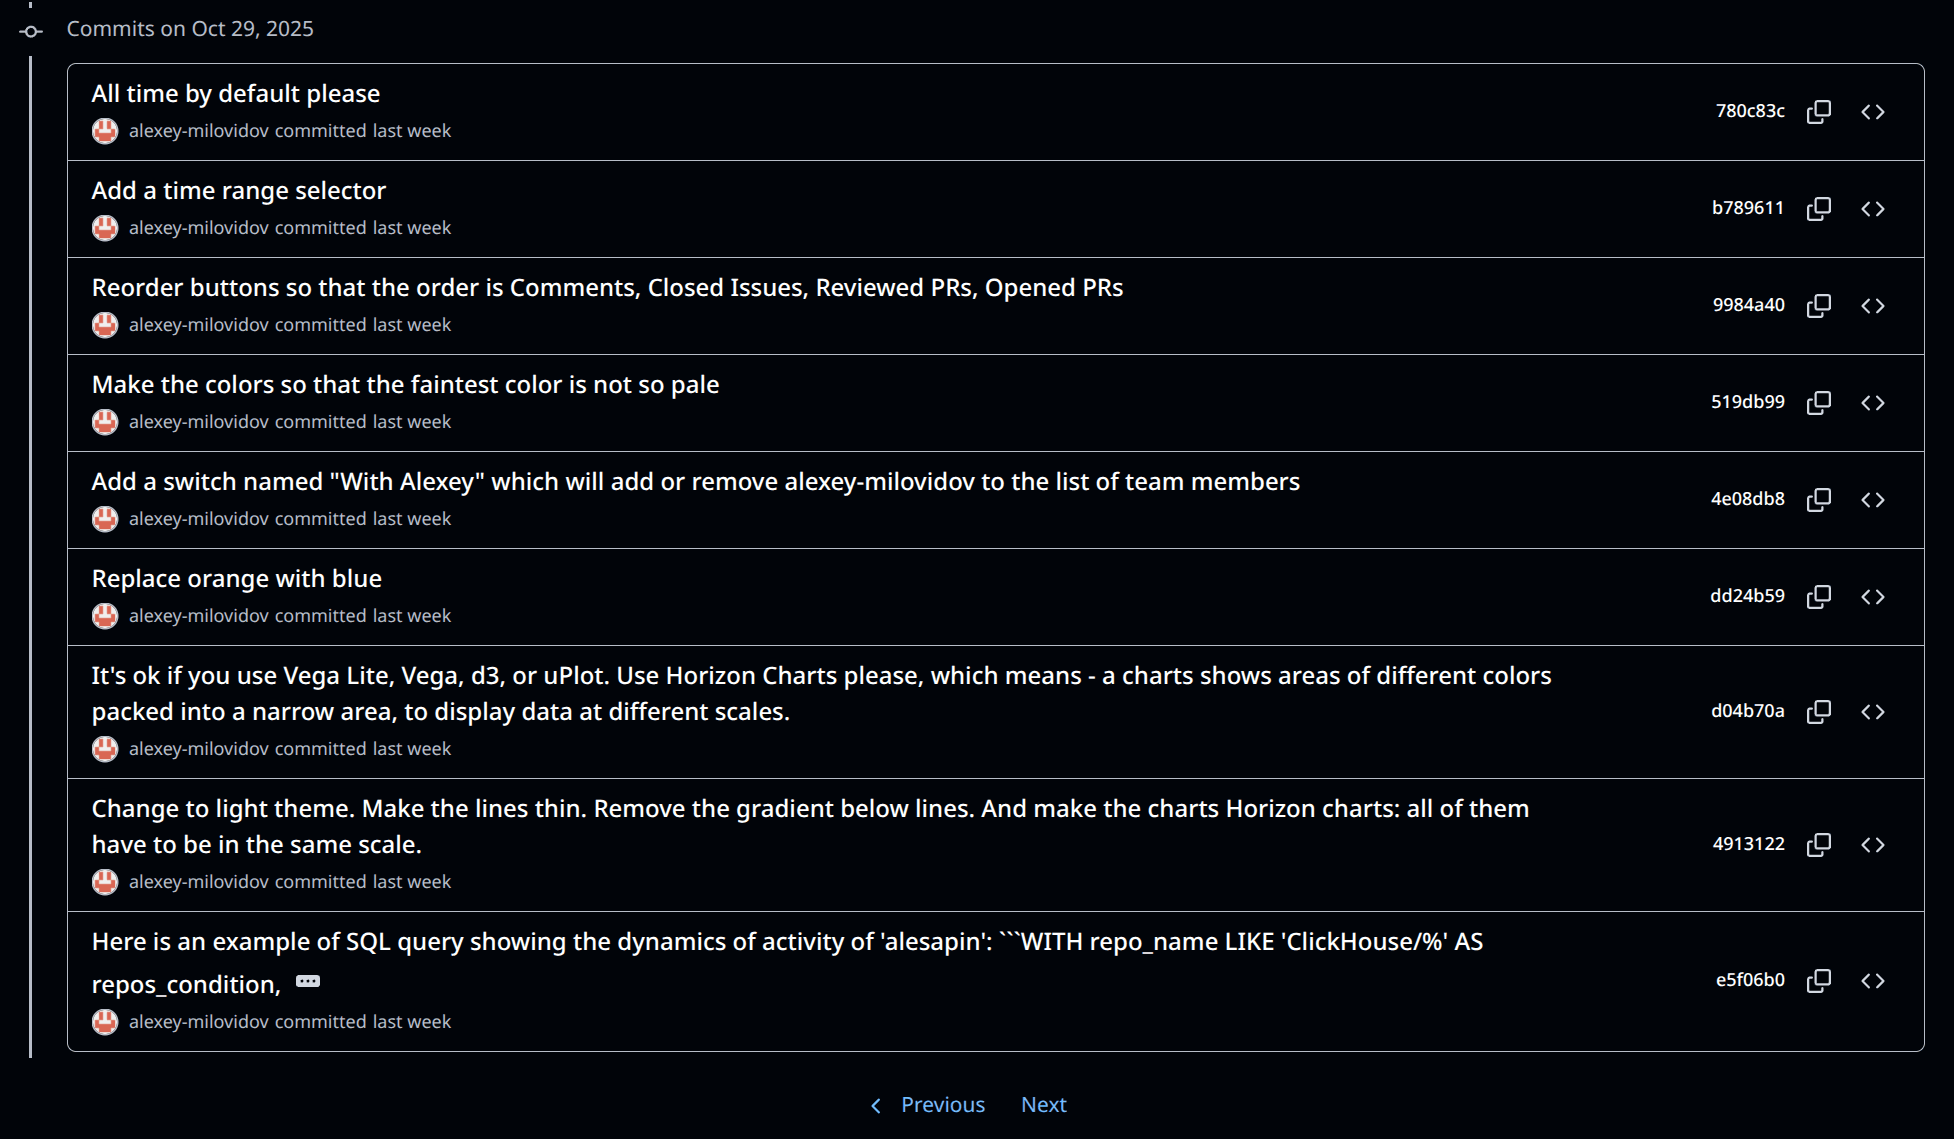
It took only half of a weekend to implement this website, and I'm still impressed by how easy it was. Building analytical applications, data exploration tools, and dashboards - it's such a joy with ClickHouse! No other database comes even close in usability.