Reaching those ingestion volumes typically means running large numbers of agent-mode collectors close to application workloads and routing telemetry through centralized gateway-mode collectors. As fleets grow, so does the operational overhead. Deployments become slower, configuration drift creeps in, upgrades get riskier, and troubleshooting turns into guesswork across thousands of collectors. Because ClickHouse ingestion scales directly with the number of collectors pushing data, collector management quickly becomes the bottleneck.
This is where the Bindplane + ClickStack integration comes in. It pairs ClickStack’s proven ingestion and analytical performance with centralized, OpenTelemetry-native collector management. The goal is simple: make it easier to run ClickStack at scale without turning collector management into a full-time job.
ClickStack is a cloud-native observability stack built on ClickHouse for high-performance storage and querying of logs, metrics, and traces. It’s designed for teams dealing with large volumes of telemetry and high-cardinality data, where traditional observability platforms either fall over or become cost-prohibitive.
ClickStack focuses on horizontal scalability, efficient compression, and predictable query performance, even as data volumes grow into the petabyte range. It’s commonly used for log analytics, operational monitoring, and deep investigation of production systems where ingestion rate and retention really matter.
ClickStack consists of:
HyperDX UI, a purpose-built frontend for exploring and visualizing observability data
A custom-built OpenTelemetry Collector, with an opinionated schema for logs, metrics, and traces
ClickHouse, the high-performance analytical database at the core of the stack
Learn about ClickStack
Explore the ClickHouse-powered open source observability stack built for OpenTelemetry at scale.
Bindplane is an OpenTelemetry-native telemetry pipeline built to solve the operational side of telemetry. OpenTelemetry standardizes how data is collected and transported, but it doesn’t solve how you manage thousands of collectors safely and consistently. That’s the gap Bindplane fills.
Bindplane lets you collect, refine, and route metrics, logs, and traces from any source to any destination, while giving you centralized control over how collectors are configured, deployed, and upgraded.
Bindplane provides:
Centralized management for thousands to over one million OpenTelemetry Collectors
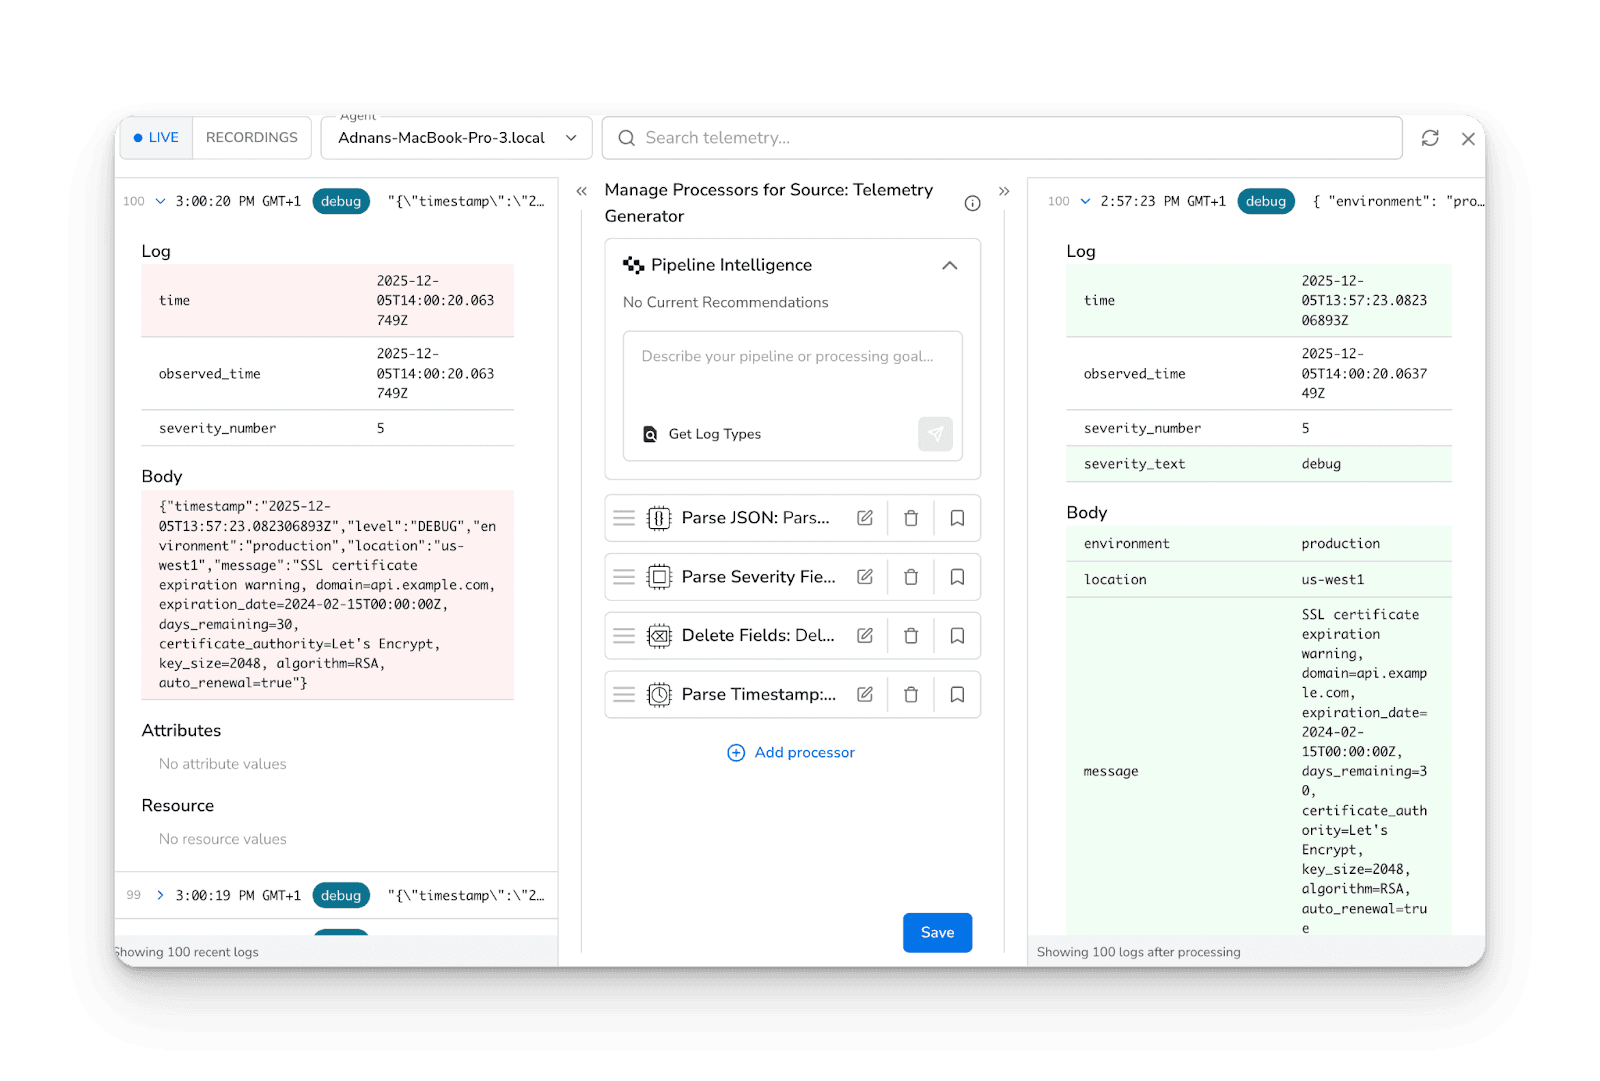
Visual configuration editing with safe, one-click rollouts
Pipeline intelligence and processor recommendations
Real-time filtering, sampling, enrichment, and data reduction
80+ sources and 40+ destinations across observability and security
Vendor-neutral, BYOC-friendly control over your entire telemetry pipeline
It’s designed for teams running telemetry across cloud, hybrid, and on-prem environments who need to scale without losing control.
While ClickStack addresses the data problem of observability, solving classic challenges around high cardinality, fast aggregations, and low-latency queries with an integrated UI, operating observability at scale introduces a separate set of operational challenges.
At scale, observability is as much an operational challenge as it is a data problem.
ClickStack is proven at extreme ingestion and storage volumes, with customers pushing gigabytes per second and managing hundreds of petabytes, but reaching these levels requires large fleets of agents distributed across edge environments and centralized gateways. As those fleets grow, deployment, configuration, upgrades, and consistency quickly become a major burden.
Bindplane addresses this challenge by centralizing agent orchestration and pipeline management. It simplifies rollouts and ongoing operations, making it far easier to run ClickStack reliably at enterprise scale. This value applies equally to open source users managing their own agents today and to ClickHouse Cloud users who need enterprise-grade control as their workloads continue to grow.
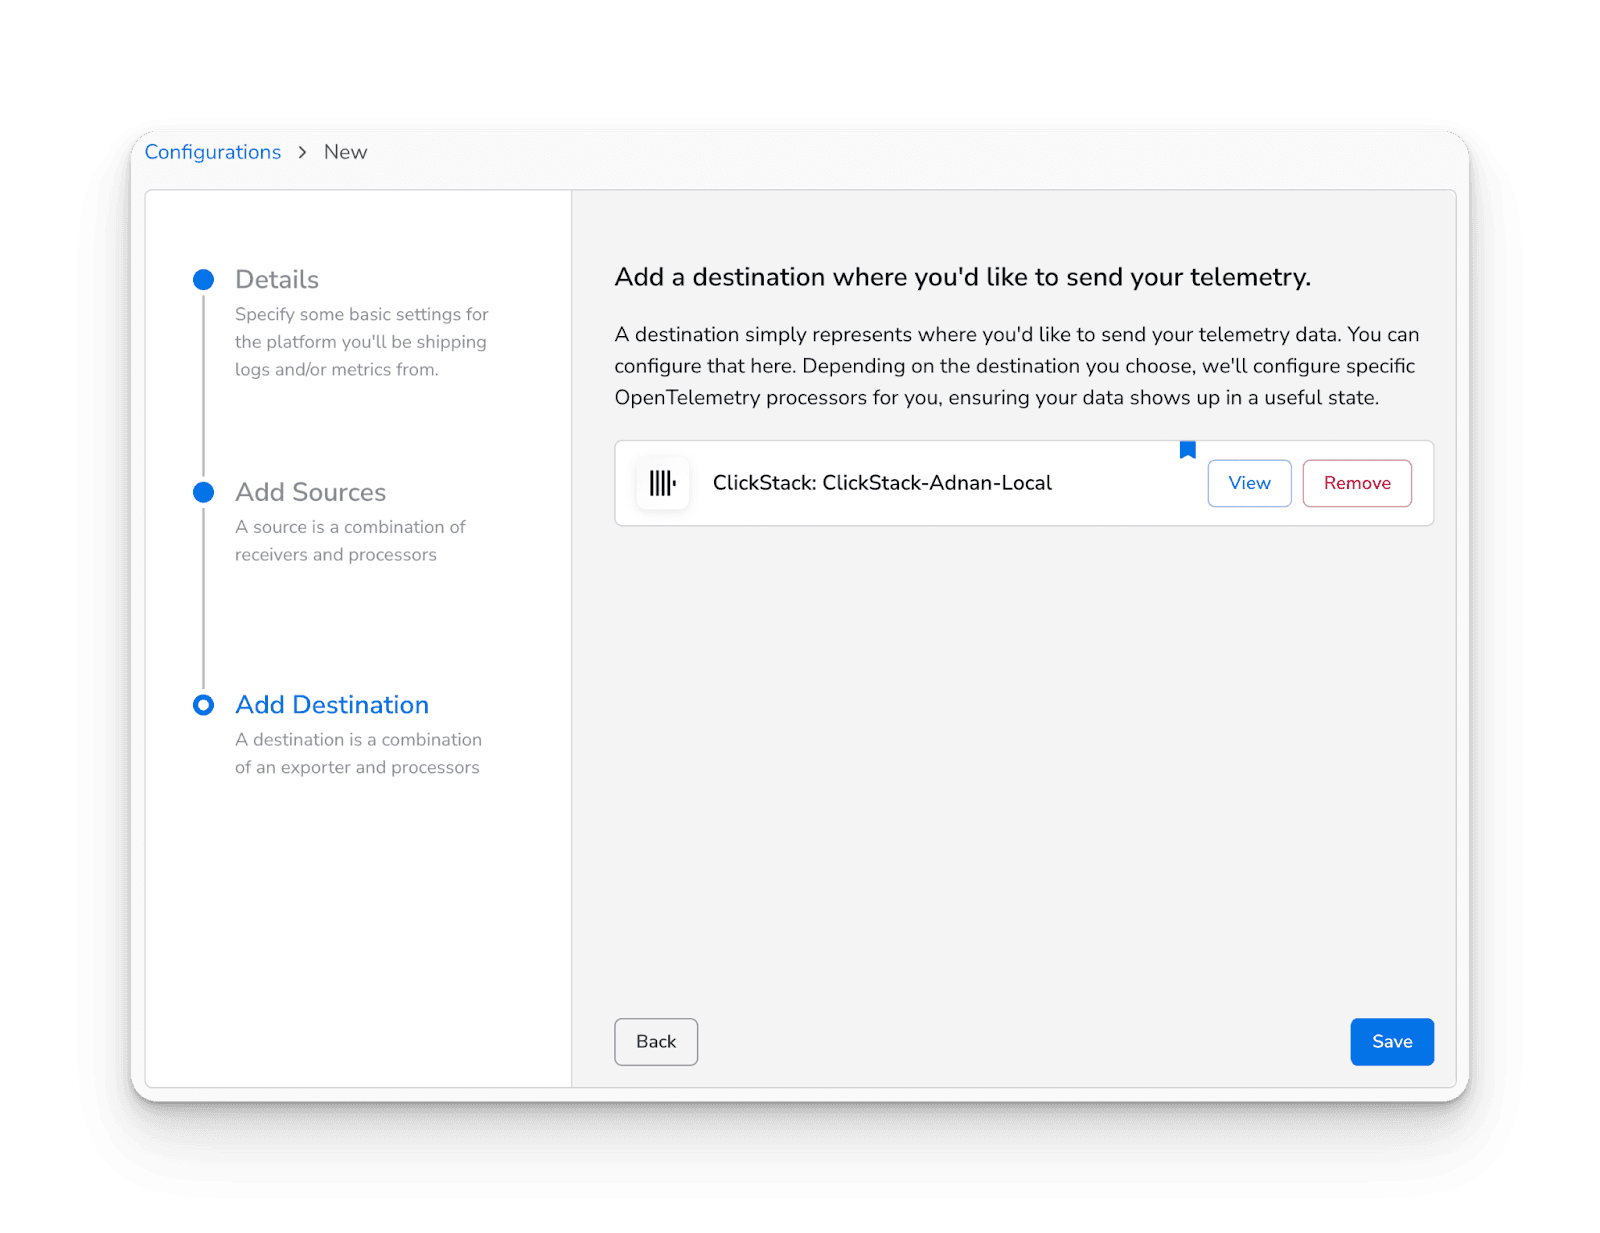
With this integration, Bindplane can collect, transform, and route telemetry to ClickStack using OpenTelemetry standards. ClickStack becomes a first-class destination inside a centrally managed telemetry pipeline.
This enables:
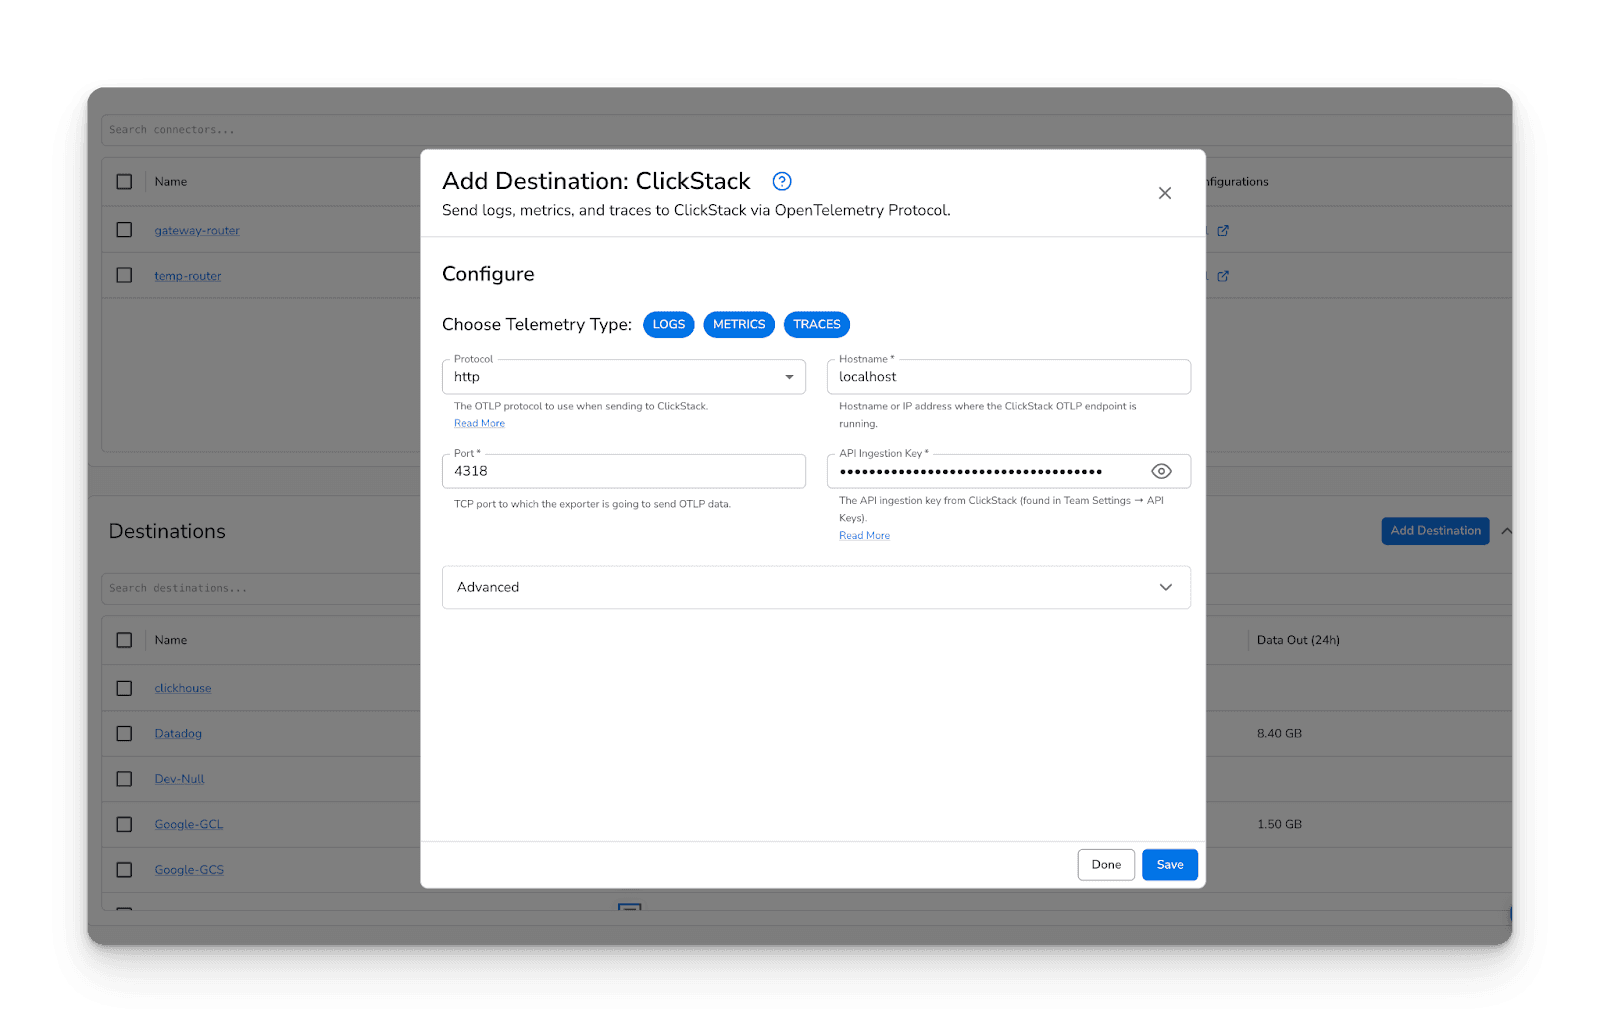
Simple setup using Bindplane’s native ClickStack destination — no custom exporters or hand-built configs
Automatic resource detection and enrichment applied consistently before data reaches ClickStack
Fan-out routing, so the same telemetry streams can be sent to ClickStack and other observability or SIEM platforms at the same time
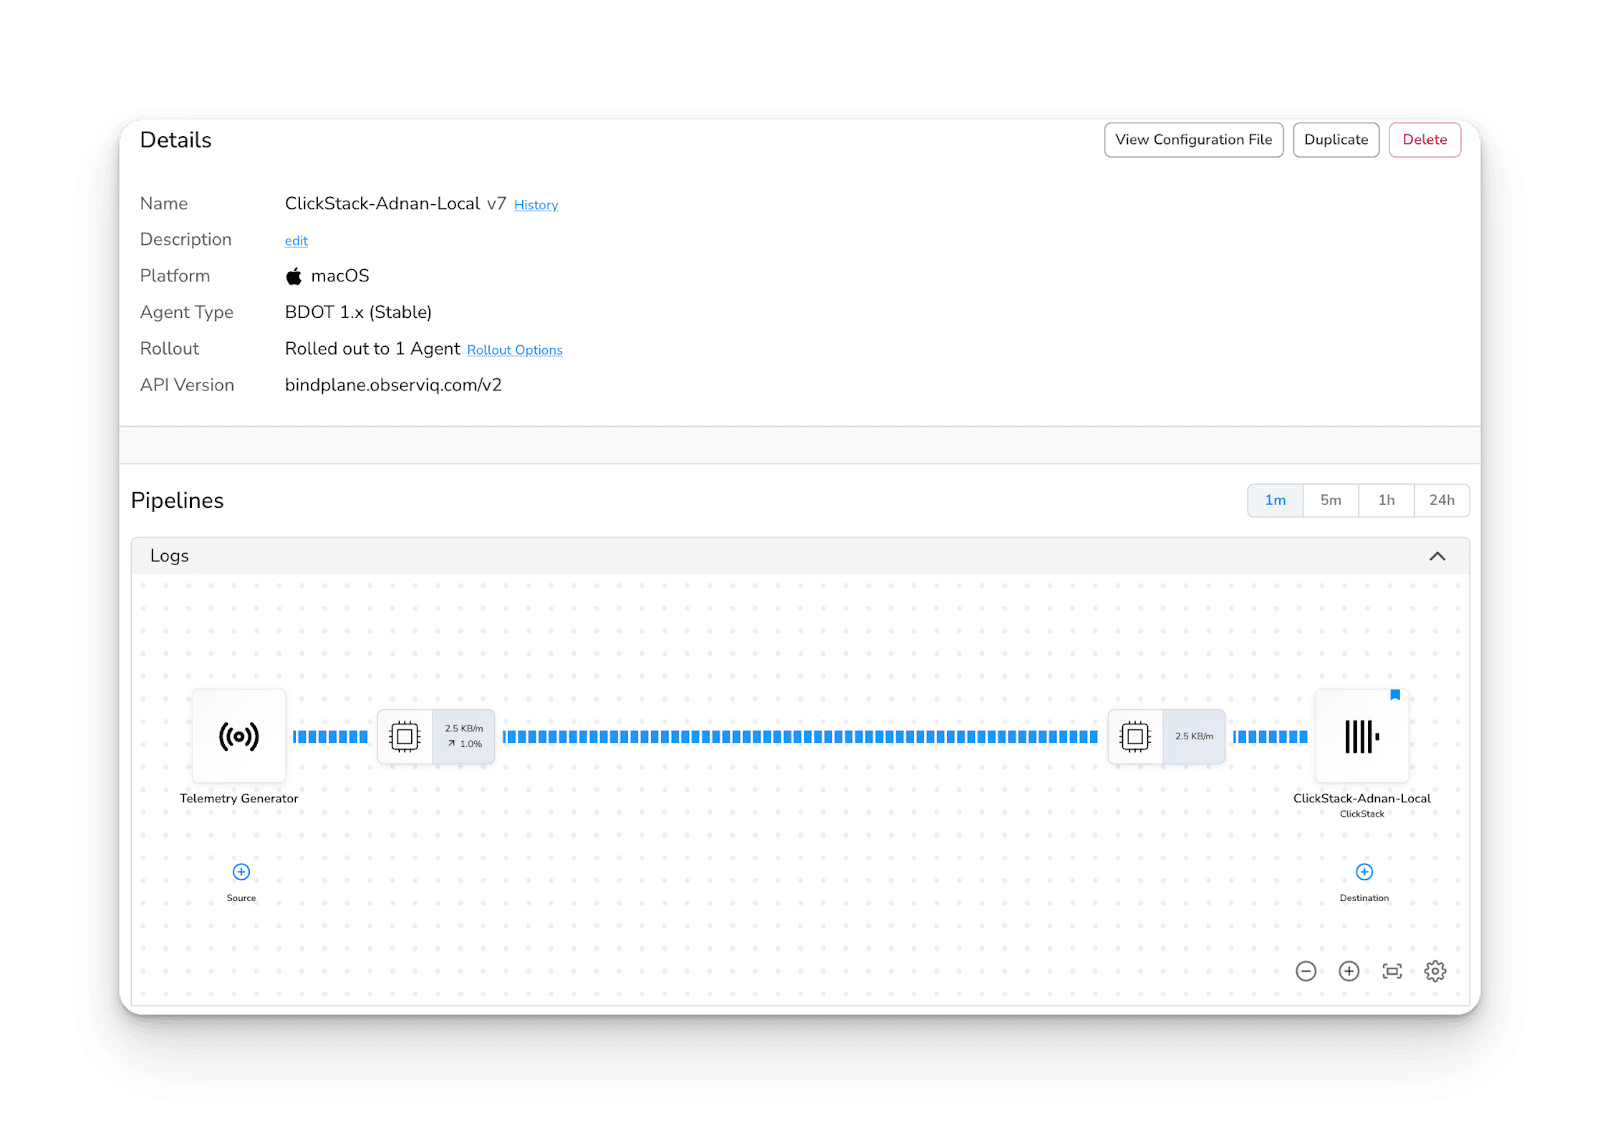
Full pipeline visibility, including collector health, throughput, and end-to-end performance
At scale, ClickHouse performance is only as good as the collectors feeding it. Bindplane centralizes collector orchestration across large fleets, making deployments, configuration changes, and upgrades far easier to operate as ingestion grows. This matters for users running their own collector fleets and need enterprise-grade collector management as their ClickStack deployments expand.
This is an important step forward for embedding both Bindplane and ClickStack into the broader OpenTelemetry ecosystem.
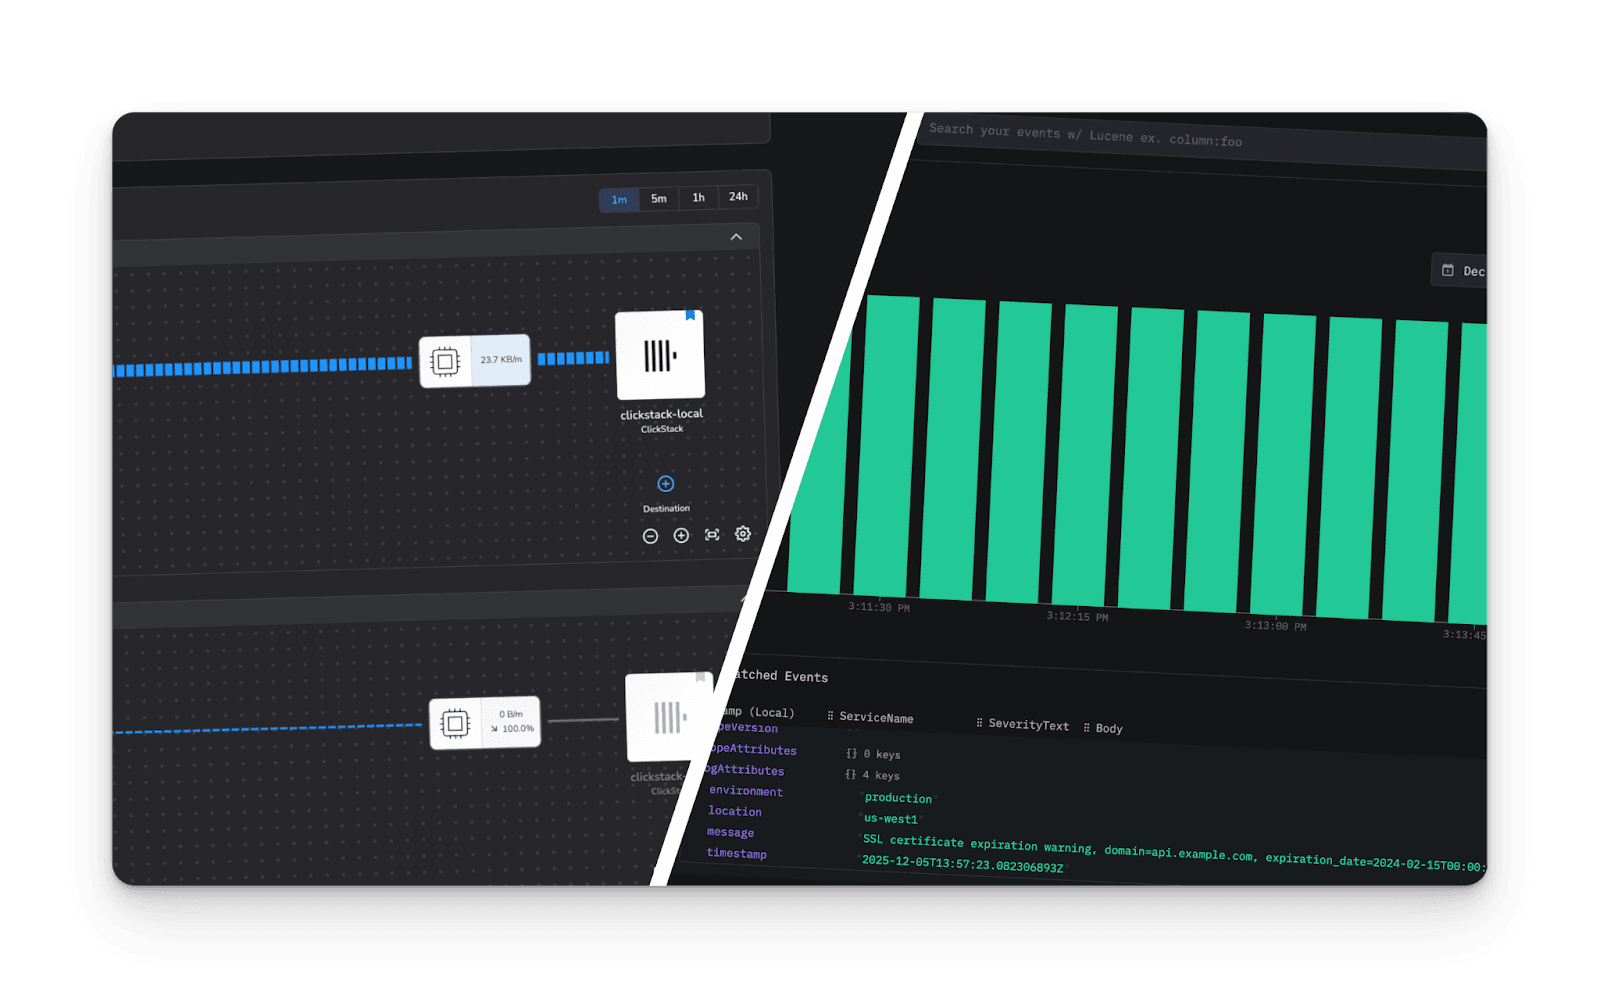
As soon as the configuration is rolled out, telemetry starts flowing into ClickStack from your managed collector fleet. Because Bindplane handles enrichment and transformation upstream, the data arriving in ClickStack is consistent, structured, and ready for analysis.
You can now:
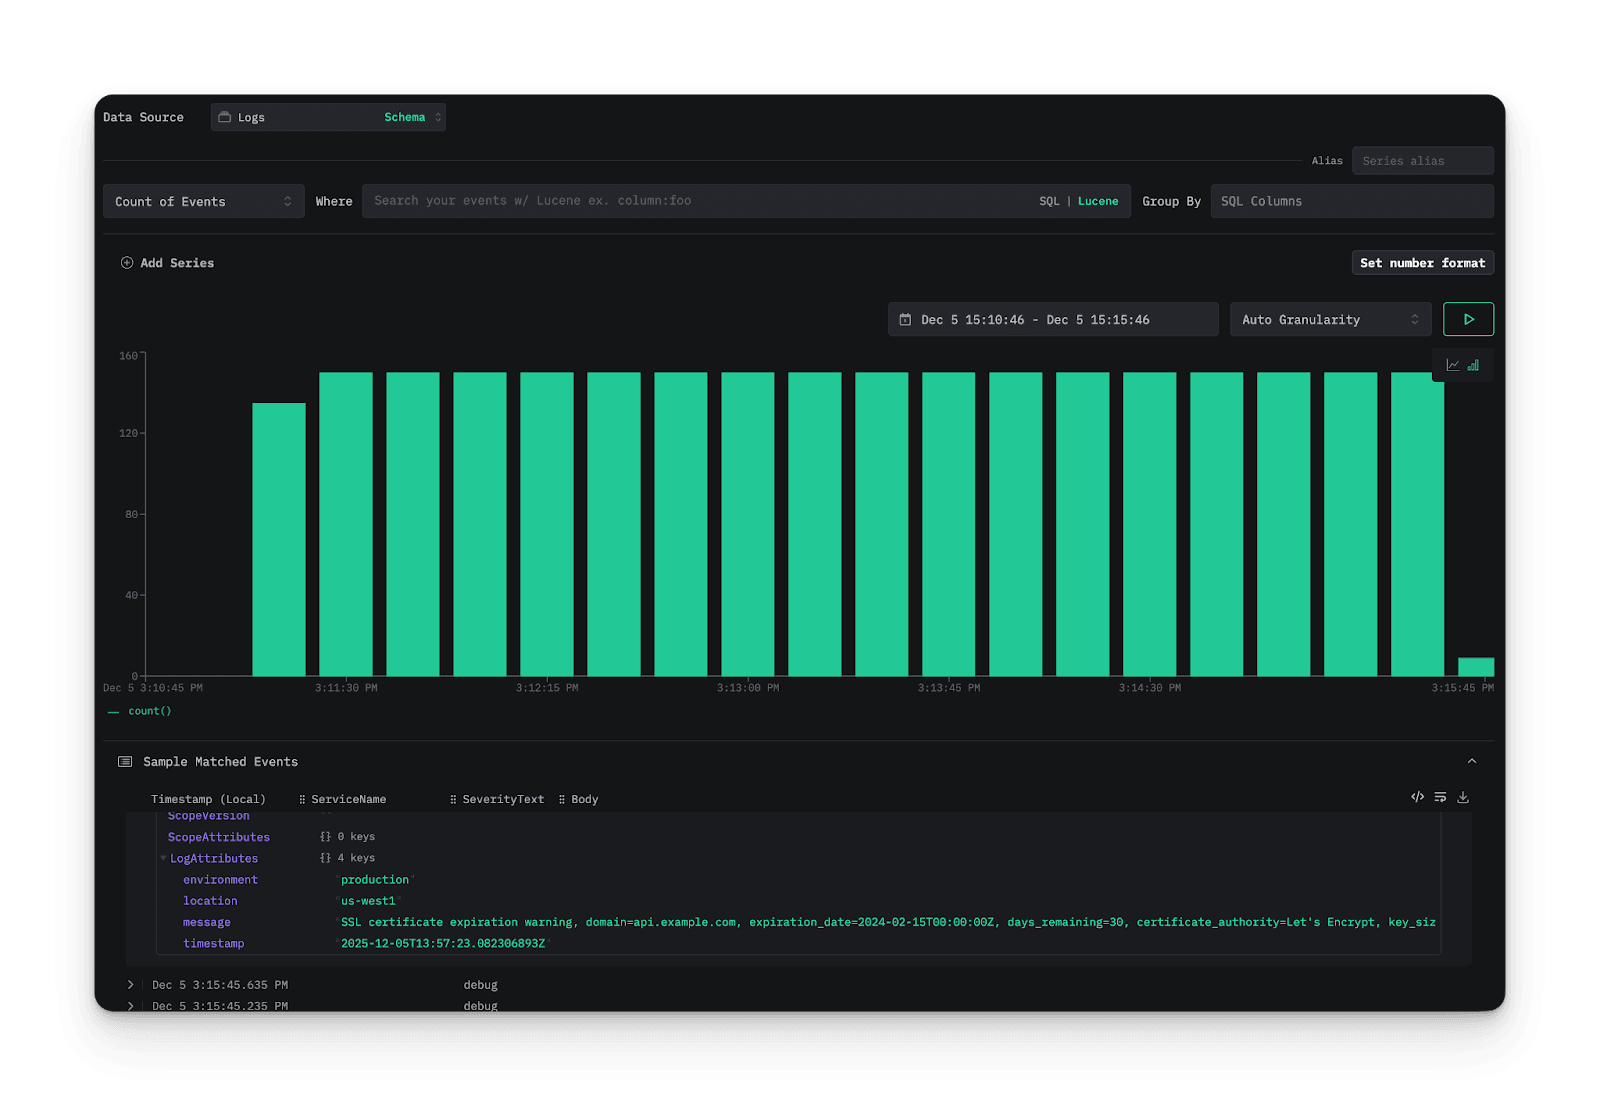
View logs, metrics, and traces in ClickStack
Build dashboards and alerts on top of high-volume datasets
Troubleshoot services end-to-end using correlated telemetry
Analyze enriched telemetry processed consistently across your fleet
ClickStack focuses on what it does best; ingestion, storage, and fast analytical queries.
Bindplane handles the operational complexity of running and managing fleets of collectors feeding it. Together, they make scaling observability about data volume, not operational pain.
We're continuing to expand the Bindplane integration ecosystem to help teams build scalable, vendor-neutral telemetry pipelines. Want to see a specific integration added? Let us know in the Bindplane Slack Community!