If you're using Serilog in a .NET application today, your logs likely go to Seq, ELK, or a cloud logging platform. But scaling logging infrastructure is hard: queries get slower, costs increase, and pipelines become harder to manage.
ClickHouse offers a different approach: instead of treating logs as something you ship to a specialized system, you store them in a high-performance analytical database and query them with SQL. ClickHouse is designed to ingest massive volumes of data and run fast queries over them. That makes it a natural fit for structured logs, where you want to filter, aggregate, and explore data efficiently.
In this post, we'll build an ASP.NET service that writes structured logs directly to ClickHouse using Serilog. If you're already using Serilog, this is a straightforward addition: one WriteTo.ClickHouse() call sends your logs straight to ClickHouse, with full control over schema, indexing, and storage.
We'll cover:
- Configuring Serilog with the ClickHouse sink
- Designing a schema using a fluent builder in C#
- Enriching logs with request-level context (correlation IDs, user data, etc.)
- Querying logs with SQL and building useful diagnostics
The full code for this demo, along with a convenient Docker setup, can be found on GitHub.
Why ClickHouse for logs? #
ClickHouse is a column-oriented analytical database that excels at append-heavy writes with analytical reads that scan huge volumes but touch only a few columns. In other words, it's perfect for storing logs.
- Columnar storage = less data read. A query like
SELECT timestamp, level, message WHERE level = 'Error'scans just those three columns, not every field on every row. - 10–20× compression, typical for logs. Storing similar values together (timestamps, log levels) compresses extremely well, cutting storage costs dramatically.
- Structured data stays structured. Native JSON support means you can store log properties as typed fields and query them directly:
WHERE properties.UserId = 'user-42'. - Full-text search built in. Inverted indexes enable fast text search across large datasets, no separate search engine required.
- SQL, not a custom query language.
GROUP BY,JOIN, window functions, materialized views, everything you already know.
On top of this, ClickStack provides a UI for exploring log data, building dashboards, searching in natural language, and more. It also supports advanced capabilities such as log clustering, which groups similar log patterns to accelerate root cause analysis.
For some real-world examples of ClickHouse deployments for observability, check out our earlier posts:
- How Trip.com migrated from Elasticsearch to ClickHouse and built a 50PB logging platform: same hardware, 4x the data capacity, and 4x-30x faster than Elasticsearch.
- How Netflix optimized its petabyte-scale logging system with ClickHouse, ingesting over 10M events/second.
Setting up the infrastructure #
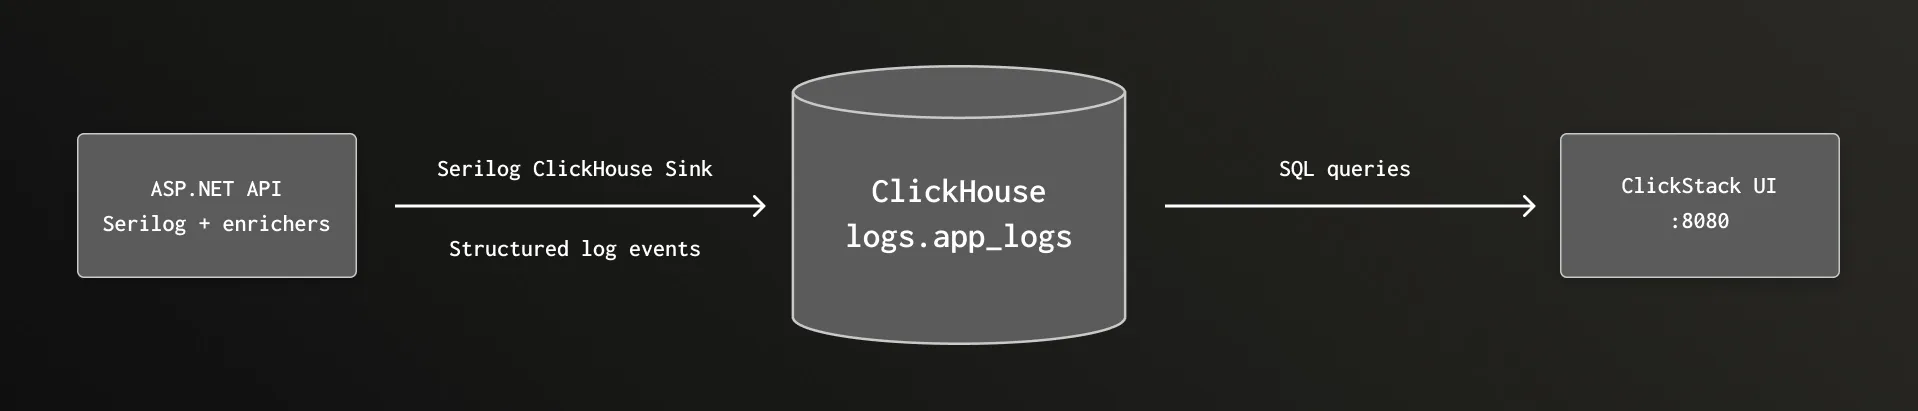
This is a high-level outline of the system that we'll put together:
Prerequisites #
- Docker with Docker Compose
Docker Compose #
Our infrastructure is two containers: ClickStack and our demo API. See docker-compose.yml for the full docker setup.
ClickStack bundles ClickHouse, an observability UI, and an OTel collector into a single container. We use ClickStack here for convenience, but the Serilog sink writes directly to ClickHouse via its HTTP interface. This direct approach gives us full control over the table schema: custom columns, typed JSON, partitioning, and compression codecs.
The DEFAULT_CONNECTIONS and DEFAULT_SOURCES environment variables pre-provision a custom data source so the ClickStack UI can query our logs table.
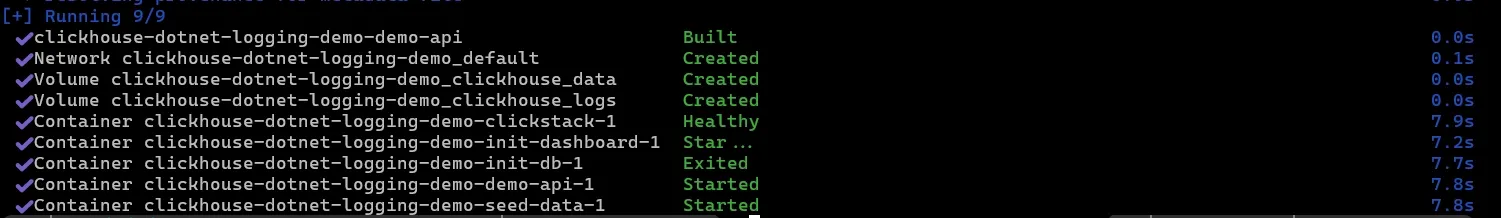
Want to see the end result first?
1git clone https://github.com/ClickHouse/clickhouse-serilog-demo.git
2cd clickhouse-serilog-demo
3docker compose up
…and open http://localhost:8080 to start exploring the logs.
Building the demo API #
The service #
Our demo is a simple product catalog and ordering API with no separate database. It produces diverse log events across all log levels:
| Endpoint | Log behavior |
|---|---|
GET /products | Info: catalog listed |
GET /products/{id} | Info: found / Warning: not found |
POST /products | Info: product created |
POST /orders | Info: placed / Warning: low stock / Error: out of stock or payment failure |
GET /orders/{id} | Warning: not found |
It also includes a few utility endpoints for health checks and traffic generation.
Serilog + ClickHouse sink configuration #
First, install the required packages:
1dotnet add package Serilog.AspNetCore
2dotnet add package Serilog.Enrichers.Environment
3dotnet add package Serilog.Sinks.ClickHouse
Serilog.AspNetCore brings in the core Serilog integration and UseSerilogRequestLogging(). Serilog.Enrichers.Environment adds WithMachineName(). Serilog.Sinks.ClickHouse is the sink itself.
Because the Serilog sink writes directly to ClickHouse, you get full control over the table schema with no intermediary pipeline to manage. We configure the sink and table schema at startup. You don't need to understand all of this to get started—the defaults work fine, but you have complete control over the schema when you need it.
builder.Host.UseSerilog((context, services, loggerConfiguration) =>
{
    loggerConfiguration
        .MinimumLevel.Debug()
        .ReadFrom.Configuration(context.Configuration)
        .Enrich.FromLogContext()
        .Enrich.WithProperty("ServiceName", "DemoApi")
        .Enrich.WithMachineName()
        .WriteTo.Console()
        .WriteTo.ClickHouse(
            connectionString: context.Configuration["ClickHouse:ConnectionString"]!,
            configureSchema: schema => schema
                .WithDatabase("logs")
                .WithTableName("app_logs")
                .AddTimestampColumn()
                .AddLevelColumn()
                .AddMessageColumn()
                .AddMessageTemplateColumn()
                .AddExceptionColumn()
                .AddPropertiesColumn("properties", "JSON(ServiceName String, RequestPath String, Elapsed Float64, UserId String, OrderId String, OrderStatus String)")
                .AddPropertyColumn("CorrelationId", "Nullable(String)")
                .AddPropertyColumn("RequestPath", "Nullable(String)")
                .AddPropertyColumn("StatusCode", "Nullable(Int32)", writeMethod: PropertyWriteMethod.Raw)
                .AddPropertyColumn("ServiceName", "LowCardinality(String)")
                .AddIndex("INDEX idx_message message TYPE text(tokenizer = splitByNonAlpha, preprocessor = lowerUTF8(message)) GRANULARITY 8")
                .WithEngine(@"ENGINE = MergeTree
                              ORDER BY (level, timestamp)
                              TTL timestamp + toIntervalDay(30)"),
            flushInterval: TimeSpan.FromSeconds(2));
});
Let's break down the schema builder:
AddTimestampColumn()—DateTime64(6)with microsecond precision in UTC.AddLevelColumn()— Log level as a string (Information,Warning,Error, etc.).AddMessageColumn()— The rendered message with property values substituted in.AddMessageTemplateColumn()— The original template ("Order {OrderId} placed by {UserId}"), useful for grouping similar log entries.AddExceptionColumn()— Full exception text including stack trace, or empty when there's no exception.AddPropertiesColumn("properties", "JSON(...)")— All enrichment properties as a ClickHouse JSON column. The second argument declares type hints for frequently queried subcolumns —ServiceNameasString,ElapsedasFloat64,UserIdasString, and so on. ClickHouse still accepts any other properties dynamically; the typed hints just enable better compression and faster queries on those specific paths. Without type hints,AddPropertiesColumn()creates a plainJSONcolumn that infers types at insert time.AddPropertyColumn("CorrelationId", ...)— PromotesCorrelationIdto its own top-level column. Since it's used in nearly every query to trace requests, having it as a dedicated column is faster and more convenient.AddPropertyColumn("StatusCode", ..., PropertyWriteMethod.Raw)—Rawtells the writer to extract the CLR value (anint) rather than its string representation.AddIndex("INDEX idx_message ...")— adds a full-text index on themessagecolumn. Thetextindex type builds an inverted index usingsplitByNonAlphatokenization andlowerUTF8preprocessing.WithEngine()— lets you provide a custom table engine creation string. In this case, we order the logs by level and timestamp, and set a 30-day time-to-live.
Notice the .ReadFrom.Configuration(context.Configuration) call which picks up level overrides from appsettings.json. As recommended by the Serilog.AspNetCore docs, we silence the noisy built-in ASP.NET Core log sources so that UseSerilogRequestLogging() becomes the single source of truth for HTTP request events:
1{
2  "Serilog": {
3    "MinimumLevel": {
4      "Override": {
5        "Microsoft.AspNetCore.Hosting": "Warning",
6        "Microsoft.AspNetCore.Mvc": "Warning",
7        "Microsoft.AspNetCore.Routing": "Warning"
8      }
9    }
10  }
11}
Without these overrides, you'd see multiple verbose events per request from the ASP.NET hosting and routing pipeline.
The sink automatically creates the logs database and app_logs table on the first batch write. In a production environment, it's recommended to handle the schema externally instead of letting the library create the table automatically: that gives you more predictable control and allows you to independently handle migrations.
Production schema patterns
The demo schema is deliberately simple. In a production deployment, you'd typically make use of the deep configuration options that ClickHouse provides in order to optimize performance. For example, codec declarations such as CODEC(Delta(8), ZSTD(1)) let you tune compression for time-series-like columns.
And if you're running in Kubernetes, you'd want columns like Namespace, PodName, and ContainerName possibly included in the ORDER BY key for fast filtered queries. Check out our previous post, Building an Observability Solution with ClickHouse for a deeper dive into modeling the data layer. A production column list might look more like this:
1`Timestamp` DateTime64(9) CODEC(Delta(8), ZSTD(1)),
2`SeverityText` LowCardinality(String) CODEC(ZSTD(1)),
3`ServiceName` LowCardinality(String) CODEC(ZSTD(1)),
4`Body` String CODEC(ZSTD(1)),
5`Namespace` LowCardinality(String),
6`PodName` LowCardinality(String),
7`ContainerName` LowCardinality(String),
8`Properties` JSON
Correlation ID middleware #
We will also set up a middleware layer to handle correlation IDs, which will let us trace related requests across different services. Every request gets a correlation ID, either from the X-Correlation-ID header or (if the header is missing) a new GUID. It's pushed onto Serilog's LogContext so every log entry within that request automatically carries it:
public sealed class CorrelationIdMiddleware(RequestDelegate next)
{
    public async Task InvokeAsync(HttpContext context)
    {
        var correlationId = context.Request.Headers["X-Correlation-ID"].FirstOrDefault()
                            ?? Guid.NewGuid().ToString();

        context.Response.Headers["X-Correlation-ID"] = correlationId;

        using (LogContext.PushProperty("CorrelationId", correlationId))
        {
            await next(context);
        }
    }
}
Register this before UseSerilogRequestLogging() in the middleware pipeline, so the correlation ID appears in the Serilog request summary event too.
One event per request #
UseSerilogRequestLogging() replaces ASP.NET's verbose per-middleware logging with a single summary event per request that includes the HTTP method, path, status code, and elapsed time. Cleaner and more efficient.
You can enrich this completion event with additional properties: globally via EnrichDiagnosticContext and per-endpoint via IDiagnosticContext. Our demo does both. In the middleware configuration, you can add variables from the HttpContext, such as the user agent string:
app.UseSerilogRequestLogging(options =>
{
    options.EnrichDiagnosticContext = (diagnosticContext, httpContext) =>
    {
        diagnosticContext.Set("RequestHost", httpContext.Request.Host.Value ?? "unknown");
        diagnosticContext.Set("UserAgent", httpContext.Request.Headers.UserAgent.ToString());
    };
});
Then in individual endpoints, you can attach properties specific to that endpoint which will appear on the same completion event:
app.MapPost("/orders", (OrderRequest request, OrderService orders,
    IDiagnosticContext diagnosticContext) =>
{
    diagnosticContext.Set("UserId", request.UserId);
    diagnosticContext.Set("ProductId", request.ProductId);
    // ...
});
Health check #
The /health endpoint uses ASP.NET Core's built-in health check framework to verify ClickHouse connectivity. We use a simple IHealthCheck that opens a connection and runs SELECT 1 (see ClickHouseHealthCheck.cs).
Graceful shutdown #
Because the sink batches events in memory, you must call Log.CloseAndFlush() (or its async counterpart) before the process exits, otherwise the last partial batch is lost. Our demo wraps app.Run() in a try/finally:
try
{
    app.Run();
}
finally
{
    await Log.CloseAndFlushAsync();
}
This ensures the final in-memory batch is flushed during normal shutdown.
Running the demo #
Start the stack:
1docker compose up -d
After ~15 seconds, the demo API is available at http://localhost:5000, the ClickHouse Play UI at http://localhost:8123/play, and a dashboard UI at http://localhost:8080.
The API includes a built-in traffic generator that exercises every endpoint:
1curl -X POST http://localhost:5000/generate-traffic
You'll see structured log output in the console:
[14:23:01 INF] Product catalog listed — 5 products
[14:23:01 WRN] Product 999 not found
[14:23:01 INF] Product 6 (Standing Desk) created in category Furniture at $599.99
[14:23:01 INF] Order a1b2c3d4 placed by user-42: 2x Mechanical Keyboard for $299.98
[14:23:01 WRN] Low stock alert: product 3 (USB-C Hub) has only 3 units remaining
[14:23:01 ERR] Order failed — product 4 (Monitor Stand) is out of stock
[14:23:02 ERR] Chaos endpoint triggered — TimeoutException
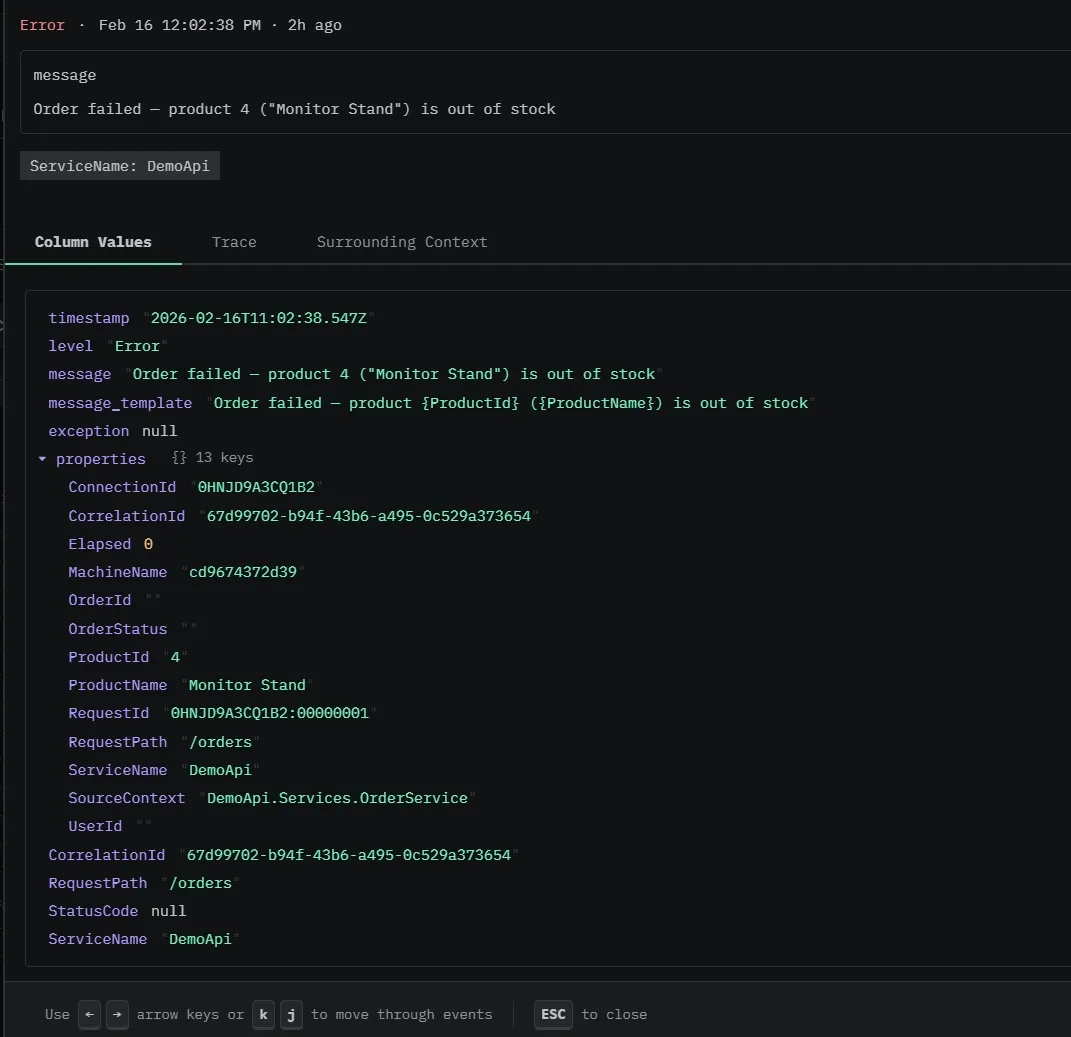
Structured logging in action #
The key difference between structured and traditional logging is that structured logs preserve data as typed, named fields rather than flattening everything into a string. Numbers stay numbers, dates stay dates, and each property is individually queryable. This makes logs into a queryable dataset and lets a columnar database like ClickHouse store and compress them efficiently.
Here's how the order service logs a successful order:
_logger.LogInformation(
    "Order {OrderId} placed by {UserId}: {Quantity}x {ProductName} for {TotalPrice:C}",
    orderId, request.UserId, request.Quantity, product.Name, product.Price * request.Quantity);
This produces a log event with named, typed properties, not just a flat string. In ClickHouse, you can then query:
1SELECT * FROM logs.app_logs
2WHERE properties.UserId = 'user-42'
3ORDER BY timestamp DESC;
Exploring your logs #
Since your logs are standard ClickHouse tables, you can query them with any SQL client. The fastest way to start is ClickHouse's built-in Play UI at http://localhost:8123/play or the ClickStack interface at http://localhost:8080.
In the ClickStack UI, you can see both the rendered log message and the underlying structured properties.
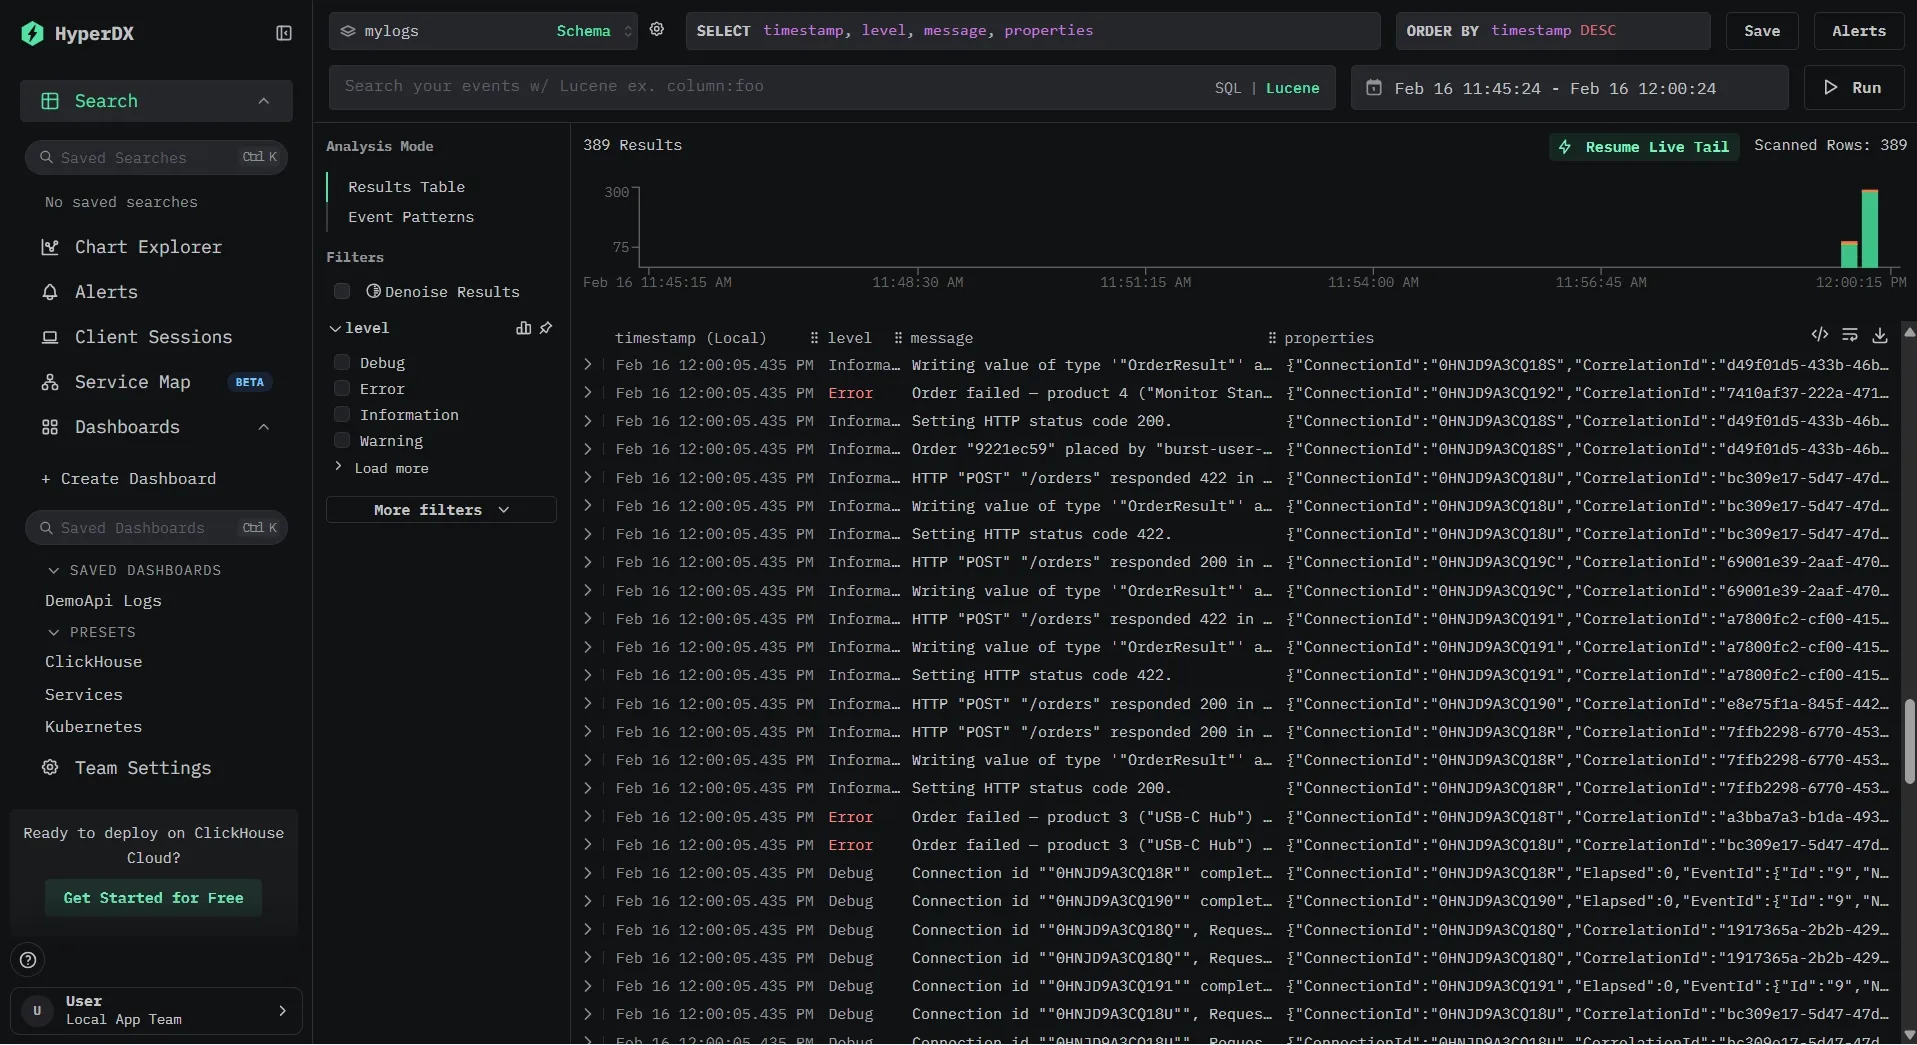
Our ClickStack instance is pre-configured with a data source pointing at our logs.app_logs table and a pre-built dashboard that lights up as soon as the demo generates traffic.
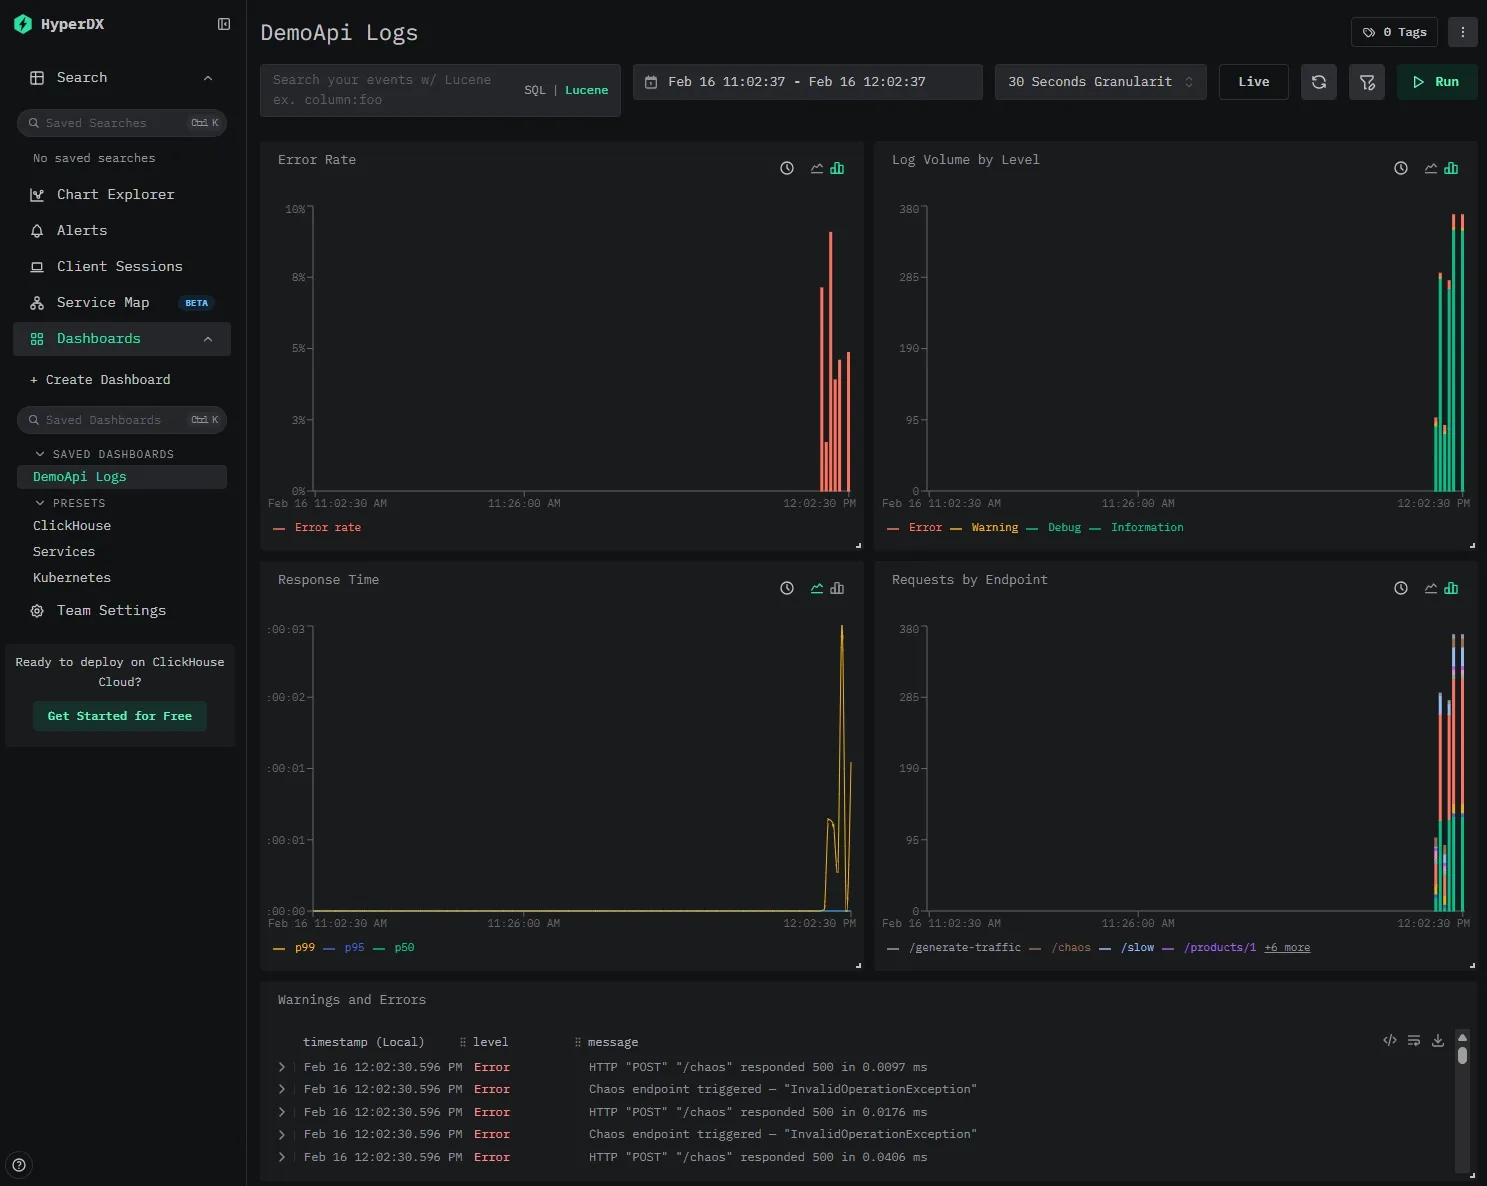
The dashboard includes five tiles that demonstrate what you get out of the box with structured log data in ClickHouse:
- Error Rate — A stacked bar chart showing
countIf(level='Error') / count()per time bucket, giving you an at-a-glance view of error spikes. - Log Volume by Level — Total log count grouped by severity level. Useful for spotting shifts in logging patterns (e.g., a sudden flood of warnings).
- Response Time (p50 / p95 / p99) — Quantile line charts over
properties.Elapsed(the millisecond duration captured by Serilog's request logging middleware). This is possible because the sink writesElapsedas a typed column, not buried in a JSON blob. - Requests by Endpoint — Log count grouped by
RequestPath, so you can see which endpoints are getting the most traffic. - Warnings and Errors — A searchable log table filtered to
level:"Warning" OR level:"Error", showing timestamp, level, and message.
SQL queries #
Here are some queries to try once you've generated traffic:
Error rate per minute:
1SELECT
2    toStartOfMinute(timestamp) AS minute,
3    countIf(level = 'Error') AS errors,
4    count() AS total,
5    round(errors / total * 100, 2) AS error_rate_pct
6FROM logs.app_logs
7WHERE timestamp > now() - INTERVAL 1 HOUR
8GROUP BY minute
9ORDER BY minute;
Slow request detection:
1SELECT timestamp, message, StatusCode, properties.Elapsed
2FROM logs.app_logs
3WHERE properties.Elapsed > 1000
4ORDER BY properties.Elapsed DESC
5LIMIT 10;
And because the data is just SQL tables, you can JOIN log data with other ClickHouse tables, build materialized views for real-time aggregations, or export results to any tool that speaks SQL.
Production considerations #
Batching #
The sink batches log events before writing to ClickHouse. In ClickHouse, each insert creates a new table part (an immutable data segment that ClickHouse later merges in the background), and it's recommended to insert large batches of data at once instead of doing small, frequent inserts. If small inserts are necessary, you should enable async inserts.
The key parameters:
batchSizeLimit— Maximum events per batch (default: 10,000). Increase for high-throughput services.flushInterval— Time between flushes (default: 5 seconds). Lower for near-real-time visibility.queueLimit— Maximum events buffered in memory (default: 100,000). Back-pressure when ClickHouse is slow.
Table engines, partitioning, indexes #
ClickHouse gives you a lot of control over how your data is stored and queried. For most log workloads, the default MergeTree engine with time-based partitioning is a solid starting point:
1ENGINE = MergeTree
2PARTITION BY toMonday(timestamp)
3ORDER BY (timestamp);
This keeps data organized by time, which aligns well with typical log queries and retention policies.
You can further optimize performance by adding secondary indexes on frequently filtered columns like level or CorrelationId, allowing ClickHouse to skip large portions of data during queries. You also get per-column compression controls, allowing you to configure delta encoding and compression algorithms.
For text search, ClickHouse supports both lightweight bloom filter indexes and full-text inverted indexes. Full-text indexes deliver roughly 10x faster queries than bloom filters in real-world benchmarks, turning multi-second full-scan queries into sub-second lookups. The cost is a significantly larger index on disk. But for most deployments, that's a good trade-off: as noted in the text index GA blog, in ClickHouse Cloud, the cost of storage is often a small fraction of overall infrastructure spend.
If you want to go deeper on tuning storage layout, partitioning strategies, and index types, check out the ClickStack Performance Tuning guide.
Log retention with TTL #
ClickHouse supports automatic data expiration:
1ALTER TABLE logs.app_logs
2MODIFY TTL timestamp + INTERVAL 30 DAY
3SETTINGS ttl_only_drop_parts = 1;
After 30 days, old partitions are automatically dropped. The ttl_only_drop_parts setting ensures ClickHouse drops entire data parts rather than rewriting them to remove expired rows, which is much more efficient for log workloads where all rows in a partition expire together. No cron jobs, no manual cleanup.
Failure handling #
On the server side, ClickHouse Cloud handles the heavy lifting: automatic replication, failover, scaling, and backups. Your sink points at a connection string and you don't manage infrastructure.
On the client side, even with a perfectly healthy ClickHouse cluster, network blips happen: a DNS hiccup, or a brief connectivity drop between your service and the database. The sink handles this by buffering log events in memory and retrying on the next flush cycle. The maximum queue size, flush interval, and batch size are all configurable. For most services, the defaults give you a reasonable window.
Note that this is an in-memory buffer, not a durable queue. If the service itself restarts while the buffer is full, those events are gone. If you need guaranteed delivery, you'll want to add a fallback.
To know when any of this is happening, wire up the sink's callbacks to your alerting system. onBatchFailed is the important one: if log writes are failing, you want to know.
.WriteTo.ClickHouse(
    connectionString: "...",
    tableName: "app_logs",
    onBatchWritten: (count, elapsed) =>
        Console.WriteLine($"Wrote {count} events in {elapsed.TotalMilliseconds}ms"),
    onBatchFailed: (exception, count) =>
        Console.Error.WriteLine($"Failed to write {count} events: {exception.Message}"));
Real-time alerting with materialized views #
ClickHouse materialized views transform data on insert: you can aggregate error rates in real-time without any external pipeline. For example, to track error counts per minute:
1CREATE MATERIALIZED VIEW logs.error_counts_per_minute
2ENGINE = SummingMergeTree
3ORDER BY minute
4AS
5SELECT
6    toStartOfMinute(timestamp) AS minute,
7    level,
8    count() AS count
9FROM logs.app_logs
10WHERE level IN ('Error', 'Fatal')
11GROUP BY minute, level;
Every time a batch of logs is inserted, ClickHouse incrementally updates the aggregate. You can then query error_counts_per_minute for a real-time error dashboard or alert when counts spike. These views can then be used inside ClickStack, which has built-in support for alerting.
Resources #
- Demo source code on GitHub
- Serilog.Sinks.ClickHouse on GitHub
- ClickHouse Cloud — Managed ClickHouse with a free tier
- Serilog Documentation
- ClickStack Performance Tuning — Optimizations for production observability workloads
- Full-Text Search in ClickHouse — Now GA — Inverted indexes for sub-second log search
- How Trip.com Built a 50PB Logging Solution with ClickHouse — Migrating from Elasticsearch, 4x data capacity on same hardware
- Building a Logging Platform with ClickHouse and Saving Millions over Datadog — 200x cost reduction vs SaaS, 17x compression ratio
Conclusion #
We've built a .NET service that produces structured log events via Serilog, writes them directly to ClickHouse, and lets us query our logs using SQL.
The key takeaways:
- Drop-in for Serilog users: If your .NET app already uses Serilog, the ClickHouse sink is one
WriteTo.ClickHouse()call away. - Cost and performance: ClickHouse handles log workloads at a fraction of the cost of traditional logging platforms, with 10–20x compression and sub-second analytical queries over billions of rows.
- Full schema control: You decide how logs are stored. Typed columns, secondary indexes, partitioning, and compression codecs, all through the fluent schema builder in C#.
- Full-text search: ClickHouse's now-GA inverted indexes bring sub-second log search to your existing tables — no separate search engine required.
- No frontend lock-in: Your logs are standard ClickHouse tables. Query them with SQL in the Play UI, connect Grafana (via the ClickHouse data source plugin), Metabase, ClickStack, or any other tool that speaks SQL.
The entire demo runs with a single docker compose up. Clone the repo, generate some traffic, and see what structured logs look like in ClickHouse. When you're ready to try it with a managed deployment, get started with ClickHouse Cloud.


