OpenTelemetry (OTel) is a critical open-source framework designed to standardize the way telemetry data — metrics, logs, and traces—is collected, processed, and exported in modern software systems. This guide provides an overview of OpenTelemetry's purpose, key components, and role in improving observability across complex infrastructures, such as microservices and cloud environments.
You'll learn about the types of telemetry data OTel handles, how it simplifies monitoring and debugging, and its tools, including the OpenTelemetry Collector and language-specific SDKs for code instrumentation. The page also highlights OTel's flexibility and vendor-neutral approach and how its integration with platforms like ClickHouse enhances data analysis for large-scale systems. It provides a clear and structured look at how OpenTelemetry supports reliable, efficient software performance and observability.
What is OpenTelemetry (OTel)? #
OpenTelemetry (OTel) is the de facto industry standard for instrumenting, generating, collecting, and exporting telemetry data—metrics, logs, and traces. Like physical engineering standards have revolutionized mass production and global supply chains, OpenTelemetry aims to standardize how we gather and analyze data about our software systems.
The initiative focuses primarily on generating and collecting telemetry data, providing language-specific SDKs for instrumentation and the OpenTelemetry Collector for processing and exporting this data to your chosen analysis tools. This comprehensive approach helps organizations maintain a clear and consistent method for monitoring their systems across various platforms and environments.
As a complex system catering to a broad array of stakeholders, OpenTelemetry's ultimate ambition is to integrate so seamlessly into libraries, frameworks, IDEs, and platforms that it becomes an invisible yet indispensable part of modern software infrastructure. This integration promises to simplify how developers and engineers manage telemetry data, essential for achieving the observability needed to ensure robust, reliable software performance.
What is telemetry data? #
Now that we’ve defined OTel, it's crucial to understand telemetry data and why it's vital for the observability of modern software systems. Telemetry, in the context of software, refers to the generation and collection of data about a system that will help developers optimize performance, troubleshoot issues, and ensure system health.
There are three main types of telemetry data: metrics, traces, and logs. Each type serves different observability needs and provides unique insights into your systems.
Metrics #
Metrics are numerical measurements that capture the ongoing performance and health of systems. Examples include request counts per second, millisecond response times, memory usage, and CPU utilization. Metrics can also track business-critical data, such as active users or transaction volumes.
For example, an online retail website might track the number of transactions per minute to monitor for peaks in activity that could strain server resources. This metric helps in scaling operations dynamically, ensuring smooth user experiences during sales or promotional events.
OpenTelemetry facilitates the collection of these metrics, allowing teams to set performance baselines and create alerting systems that notify them when deviations occur. This data is crucial for capacity planning and identifying potential issues before they escalate.
Traces #
Traces document the path of a request across various services within a system, from start to finish. This includes interactions across microservices, database queries, and external API calls.
For example, in a healthcare app, tracing a patient's record request from the web frontend, through the authentication service, down to the database and back, can help identify latency issues or data bottlenecks that impact user experience.
OpenTelemetry's tracing tools provide insights into how requests are processed and where delays or failures occur, making them invaluable for debugging and optimizing distributed systems. Traces highlight service dependencies and performance bottlenecks, offering a roadmap for system improvements.
Logs #
Logs are detailed records of events that occur within systems, such as application errors, user authentication attempts, and security breaches. They provide a timestamped account of activities, offering an in-depth view of system operations.
For example, a cloud storage service might log every file access request to monitor for unauthorized access attempts. These logs are crucial for security audits and ensure that compliance standards regarding data access are met.
OpenTelemetry supports structured logging, enhancing the ability to efficiently analyze and interpret large volumes of log data. Logs are essential for detailed diagnostics, security monitoring, and compliance, and they serve as a critical component of post-incident analysis and auditing.
Combining metrics, traces, and logs offers a holistic view of system performance and health. OpenTelemetry's standardized approach simplifies the collection and analysis of these data types, enhancing observability across your technology stack. This integration allows teams to correlate data from different sources, providing deeper insights and more actionable intelligence to optimize systems effectively.
➡️ Read more about telemetry data
Why does OTel matter? #
As software development becomes more complex with applications spanning multiple microservices and cloud-based architectures, tracking system interactions and internal states poses significant challenges. OpenTelemetry (OTel) addresses these challenges in several key ways:
Standardization in a fragmented space #
OTel brings a standardized, flexible, and open approach to a space traditionally fragmented and dominated by proprietary vendors. This standardization is crucial as it provides a uniform way of handling telemetry data, making it easier for developers and operations teams to implement and scale observability practices without being tied to specific tools or formats.
Vendor-neutral benefits #
OTel's vendor-neutral approach is particularly valuable for organizations looking to avoid lock-in with specific monitoring tools. This flexibility allows teams to choose or switch between different observability backends as their needs evolve, reducing costs and enhancing operational agility. For businesses, this means cost savings and improvements in deploying and managing their observability infrastructure.
Enhanced flexibility and reduced costs #
By adhering to a standardized format, OTel simplifies the integration of telemetry data across different systems and platforms, including multi-cloud and hybrid environments. This ease of integration ensures that organizations maintain a clear and consistent observability strategy, regardless of the underlying technology stack. Seamlessly combining data from various sources also means that teams can gain more comprehensive insights into their systems' behavior, which is critical for troubleshooting and optimization.
Key components of OTel #
Based on its promise to simplify and standardize observability, OpenTelemetry is structured around two main components that enhance the observability of applications and infrastructure.
These components work together to ensure that OpenTelemetry's benefits can be realized across different environments and platforms, further explaining its crucial role in modern software development.
OTel Collector #
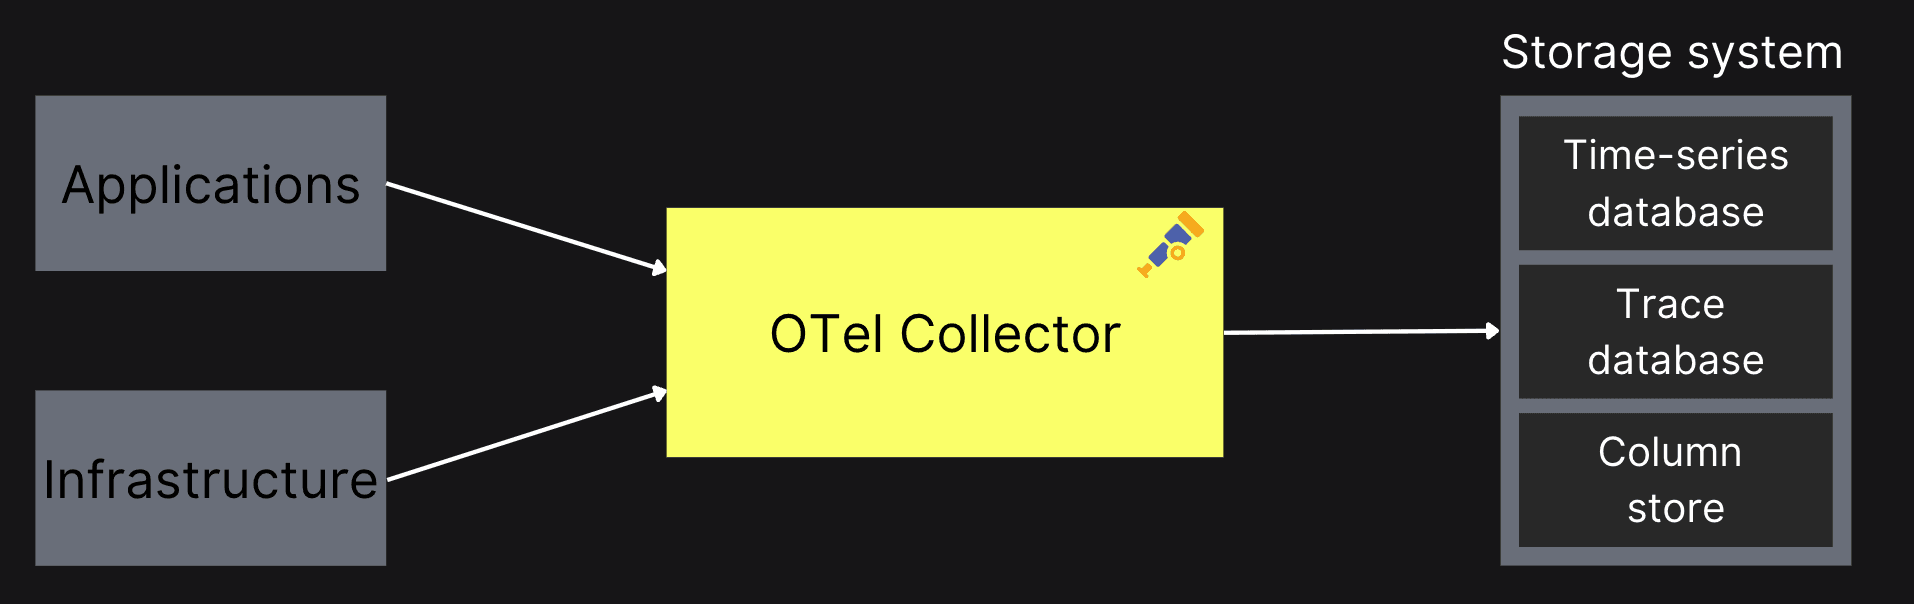
The OpenTelemetry Collector is a vendor-agnostic hub that centralizes telemetry data collection, processing, and exporting across your systems. This setup enhances scalability and supports various open-source observability data formats like Jaeger, Prometheus, and Fluent Bit. It can also export data to column stores like ClickHouse. It simplifies the observability infrastructure by replacing the need for multiple agents or collectors, allowing for seamless transmission to both open-source and commercial backends.
The collector is designed to be highly usable with a reasonable default configuration, performant under various loads, and exemplifies best practices in observability. It's also customizable and can be deployed as an agent or a more centralized collector that manages traces, metrics, and logs.
In development or small-scale environments, sending data directly to a backend can work well, but using a collector is recommended for larger setups. It quickly offloads data from services, handling complex tasks like retries, batching, and encryption, and simplifies system architecture. By default, OTLP exporters in each language assume a local collector endpoint, making setup straightforward - launching a collector automatically integrates it into your telemetry pipeline.
Code instrumentation #
- APIs and SDKs - OpenTelemetry offers stable support for traces, metrics, and logs in several key programming languages, such as C++, C#, Java, and PHP. This enables developers to instrument their applications and effectively collect telemetry data. These tools are designed to integrate seamlessly with existing code, ensuring minimal disruption while enhancing observability.
- Instrumentation libraries - OpenTelemetry supports various instrumentation libraries and automatically generates relevant telemetry data from popular libraries and frameworks. For example, libraries handling HTTP requests are instrumented to provide detailed insights into traffic patterns, helping developers understand and optimize communication flows.
- Zero-code instrumentation - To reduce developers' burden and avoid the need for manual code modifications, OpenTelemetry promotes zero-code instrumentation. This approach typically involves using an agent or similar setup that automatically instruments an application at runtime. Techniques such as bytecode manipulation or monkey patching may inject observability capabilities directly. This means developers don’t have to instrument everyday library interactions manually; instead, they benefit from out-of-the-box observability for standard operations like web requests, database queries, and message queuing.
Apart from the main components of the OpenTelemetry Collector and instrumentation libraries, OTel also includes a detailed specification outlining APIs, SDKs, and the OpenTelemetry Protocol for consistent data handling across languages. Additionally, it features a Kubernetes Operator for managing OpenTelemetry resources within Kubernetes environments and supports Function-as-a-Service monitoring with ready-to-use tools for platforms like AWS Lambda.
OpenTelemetry with ClickHouse #
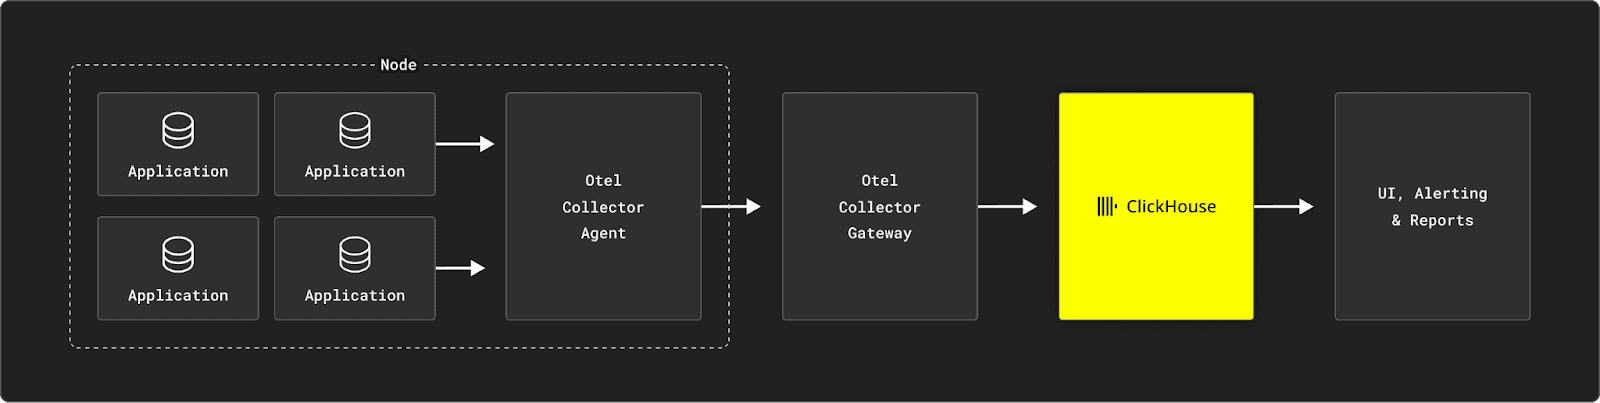
ClickHouse offers a robust SQL-based solution for handling large volumes of observability data, making it an attractive open-source alternative for organizations looking to manage costs and extend functionality. As tools like OpenTelemetry (OTel) advance, using SQL for observability becomes more feasible for those with significant data needs.
A key component enhancing this integration is the OTel Exporter for ClickHouse. This exporter facilitates the seamless transmission of telemetry data from the OpenTelemetry Collector to ClickHouse, allowing organizations to leverage ClickHouse’s capabilities in storing and analyzing large datasets. We have officially supported and contributed to developing the OTel Exporter for ClickHouse, ensuring it is well-equipped to handle extensive use cases. The development and maintenance of this exporter, led by notable community contributors, underscore its reliability and effectiveness in a production environment.
This integration showcases the practical application of OpenTelemetry with ClickHouse, providing advanced observability solutions that effectively support complex and voluminous data needs.
➡️ Read ClickHouse and OpenTelemetry
➡️ Read How we Built a 19 PiB Logging Platform with ClickHouse and Saved Millions