Modern software systems are complex. Microservices, cloud infrastructure, and distributed systems have made it increasingly difficult to understand what's happening inside our applications. When something goes wrong, teams need to know where and why quickly.
This is where observability comes in. It's evolved from simple system monitoring into a comprehensive approach to understanding system behavior. However, implementing effective observability isn't straightforward - it requires understanding technical concepts and organizational challenges.
This article covers what observability means in practice, how it works, its benefits, and common implementation challenges. We'll explore how organizations use observability to improve system reliability and team productivity.
Let's start with what observability means.
What is observability? #
Observability is understanding a system's internal state by examining its outputs. In software systems, this means understanding what's happening inside your applications and infrastructure through the data they generate.
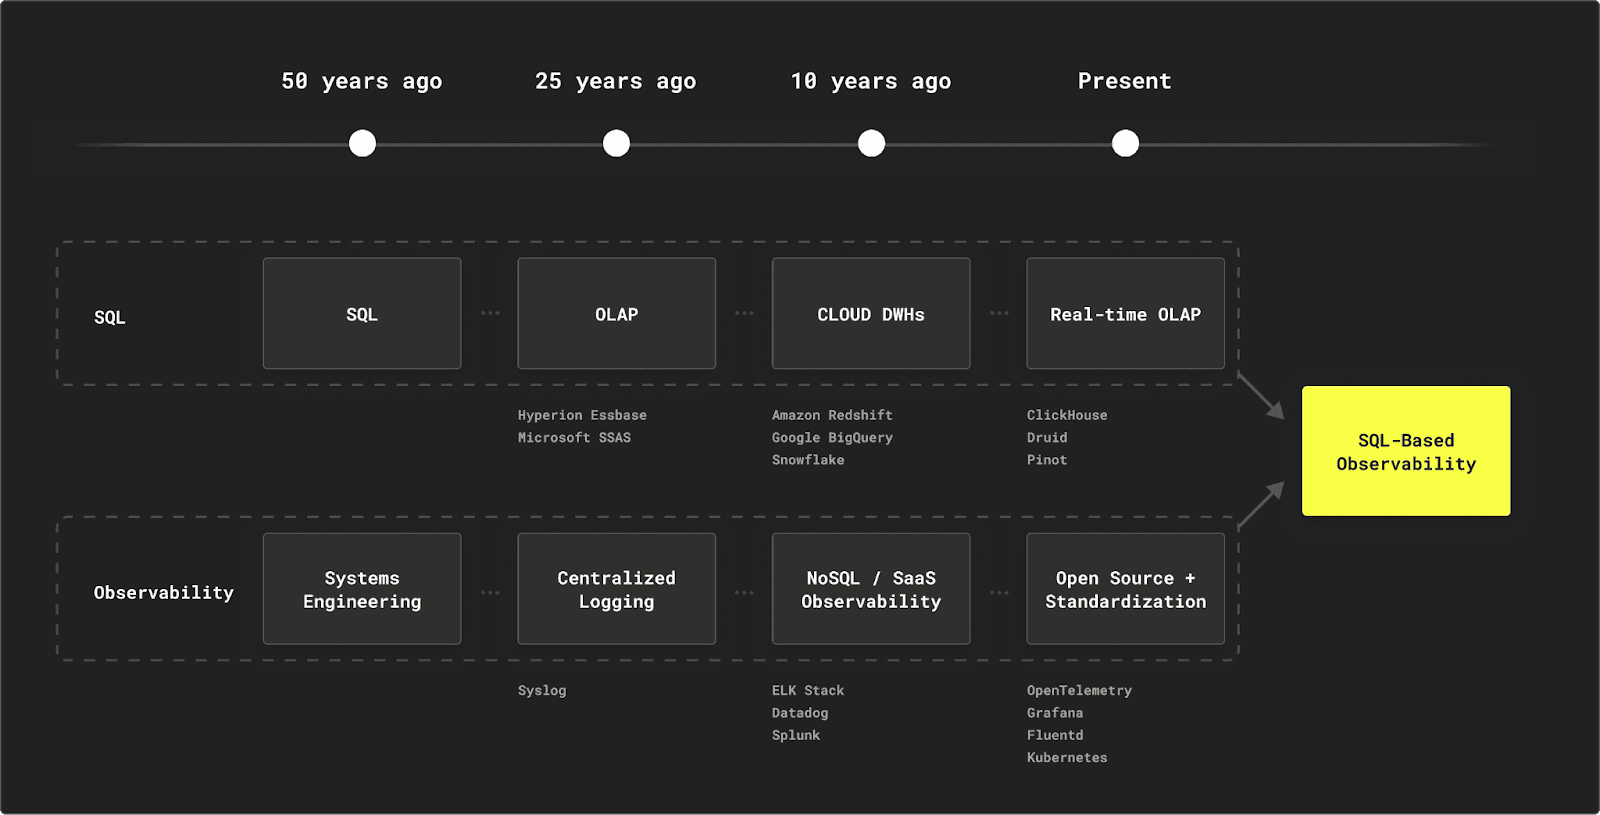
This field has evolved significantly and can be understood through two distinct generations of observability approaches.
The first generation, often called Observability 1.0, was built around the traditional "three pillars" approach of metrics, logs, and traces. This approach required multiple tools and data stores for different types of telemetry. It often forced engineers to pre-define what they wanted to measure, making it costly and complex to maintain multiple systems.
This approach required multiple tools and data stores for different types of telemetry. The resulting data silos and operational complexity have led to the development of unified, open-source observability solutions built on a single data store.
Modern observability, or Observability 2.0, takes a fundamentally different approach. It's based on collecting wide, structured events for each unit of work (e.g., an HTTP request and response) in our system. This approach captures high-cardinality data, such as user IDs, request IDs, Git commit hashes, instance IDs, Kubernetes pod names, specific route parameters, and vendor transaction IDs. A rule of thumb is adding a piece of metadata if it could help us understand how the system behaves.
This rich data collection enables dynamic slicing and dicing of data without pre-defining metrics. Teams can derive metrics, traces, and other visualizations from this base data, allowing them to answer complex questions about system behavior that weren't anticipated when the instrumentation was first added.
However, implementing modern observability capabilities presents its challenges. Organizations need reliable ways to collect, process, and export this rich telemetry data across diverse systems and technologies. While modern approaches have evolved beyond traditional boundaries, understanding the fundamental building blocks of observability remains crucial.
The 3 pillars of observability #
To better understand how observability has evolved and works in practice, let's examine the three pillars of observability - logs, metrics, and traces.
While modern observability has moved beyond treating these as separate concerns, they remain fundamental concepts for understanding different aspects of system behavior.
- Logs - Text-based records of discrete events that occur within a system. These provide detailed context about specific occurrences, errors, and state changes.
- Metrics - Numerical measurements collected over time. These include counters, gauges, and histograms that help track system performance, resource usage, and business KPIs.
- Traces - Records that track the journey of requests as they flow through distributed systems. These help understand the relationships between services and identify performance bottlenecks.
These pillars enable teams to monitor, troubleshoot, and optimize their systems. However, the real power comes from understanding how to effectively collect, analyze, and correlate data across all three pillars to gain meaningful insights into system behavior.
For a deeper dive into how these pillars work and how to collect them, see our guide on telemetry data.
The benefits of observability #
While the technical aspects of observability - logs, metrics, and traces - are well understood, the business benefits are equally important to consider.
In their book "Observability Engineering" (O'Reilly, 2022), Charity Majors, Liz Fong-Jones, and George Miranda draw from industry research and anecdotal feedback to identify four key business benefits that organizations can expect from implementing proper observability practices. Let's examine these benefits:
Higher Incremental Revenue #
The authors note that observability tools that help teams improve uptime and performance can lead to increased incremental revenue through improved code quality. This manifests in several ways:
- Improved customer experience: Fast problem resolution and prevention of service degradation leads to higher customer satisfaction and retention
- Increased system reliability: Better uptime means more successful transactions and fewer lost business opportunities
- Enhanced performance: The ability to identify and optimize performance bottlenecks helps maintain responsive services that keep customers engaged
- Competitive advantage: Organizations that can maintain high service quality through comprehensive monitoring and quick issue resolution often gain an edge over competitors
Cost Savings from Faster Incident Response #
One of the most immediate benefits of observability is reduced labor costs through faster detection and resolution of issues. This comes from:
- Reduced Mean Time to Detect (MTTD) and Mean Time to Resolve (MTTR)
- Improved query response times, enabling faster investigation
- Quicker identification of performance bottlenecks
- Reduced time spent on-call
- Fewer resources wasted on unnecessary rollbacks
We see this in practice - trip.com built their observability system with ClickHouse and achieved query speeds 4-30x faster than their previous solution, with 90% of queries completing in under 300ms, enabling rapid issue investigation.
Cost Savings from Avoided Incidents #
Observability doesn't just help resolve issues faster - it helps prevent them entirely. The authors emphasize how teams can prevent critical issues by:
- Identifying potential problems before they become critical
- Analyzing patterns to prevent recurring issues
- Understanding system behavior under different conditions
- Proactively addressing performance bottlenecks
- Making data-driven decisions about system improvements
ClickHouse's own observability platform, LogHouse, demonstrates this. It enables our core engineers to search historical patterns across all clusters, helping prevent recurring issues.
Cost Savings from Decreased Employee Churn #
One of the most overlooked benefits is the impact on team satisfaction and retention. The authors highlight how observability leads to:
- Improved job satisfaction through better tooling
- Decreased developer burnout from fewer unresolved issues
- Reduced alert fatigue through better signal-to-noise ratio
- Lower on-call stress due to better incident management
- Increased team confidence in system reliability
We see this in practice - when Fastly migrated to ClickHouse, their engineers were amazed by the improvement in query performance, noting:
"I couldn't believe it. I actually had to go back a couple of times just to make sure that I was querying it properly... this is coming back too fast. This doesn't make sense."
As the authors emphasize, while the specific measures of these benefits may vary depending on the tools and implementation, these fundamental improvements can be expected across organizations that adopt robust observability practices. The key is choosing and implementing the right tools effectively to maximize these benefits.
Achieving these benefits requires overcoming several significant hurdles. Even organizations that understand the value of observability often find that implementation presents unexpected complexities and challenges that must be carefully navigated.
Challenges in implementing observability #
Implementing observability within an organization is a transformative step toward gaining deeper insights into system performance and reliability. However, this journey is not without its challenges. As organizations strive to harness the full potential of observability, they encounter various obstacles that can impede progress. Let’s go through some of them.
Data volume and scalability #
One of the primary hurdles in implementing observability is managing the sheer volume and scalability of telemetry data generated by modern systems. As organizations grow, so does the data they need to monitor, necessitating solutions that efficiently handle large-scale data ingestion and real-time analytics.
Integration with existing systems #
Integration with existing systems poses another significant challenge. Many organizations operate in heterogeneous environments with diverse technologies, making it essential for observability tools to seamlessly integrate with current infrastructure. Open standards are crucial in facilitating this integration, ensuring interoperability and reducing the complexity of deploying observability solutions across varied tech stacks.
Skill gaps #
Skill gaps can also impede the successful implementation of observability. The transition to advanced observability solutions often requires specialized knowledge of data analytics and specific tools. Teams may need to invest in training or hiring to bridge these gaps and fully leverage the capabilities of their observability platforms.
Cost management #
Cost management is critical, as observability solutions can become expensive, particularly at scale. Organizations must balance the costs of these tools with the value they provide, seeking cost-effective solutions that offer significant savings compared to traditional approaches.
Data retention and storage #
Data retention and storage management present additional challenges. Deciding how long to retain observability data without compromising performance or insights requires careful planning and efficient storage solutions that reduce storage requirements while maintaining data accessibility.
Standardization and vendor lock-in #
Ensuring standardization and avoiding vendor lock-in are vital for maintaining flexibility and adaptability in observability solutions. By adhering to open standards, organizations can prevent being tied to specific vendors and ensure their observability stack can evolve with their needs.
Security and Compliance #
Security and compliance considerations remain crucial, especially when handling sensitive data within observability systems. Organizations must ensure that their observability solutions adhere to relevant regulations and effectively protect sensitive information.
These challenges underscore the importance of strategic planning and informed decision-making in implementing observability solutions that effectively meet organizational needs.
To address these challenges, organizations need a well-structured approach to implementing observability. The standard observability pipeline has evolved to provide a framework for effectively collecting, processing, and analyzing telemetry data. One of the earliest and most influential examples of this evolution comes from Twitter's experience in 2013.
The standard observability pipeline #
In 2013, Twitter faced unprecedented scalability challenges as its platform grew rapidly. Their engineering team needed to shift from a monolithic architecture to massively distributed systems while keeping their service running. In their influential blog post "Observability at Twitter", they outlined their mission:
"It is the Observability team's mission to analyze such problems with our unified platform for collecting, storing, and presenting metrics … As Twitter continues to grow, it is becoming more complex and services are becoming more numerous. Thousands of service instances with millions of data points require high-performance visualizations and automation for intelligently surfacing interesting or anomalous signals to the user"
This challenge led Twitter to establish what has become the standard observability pipeline, consisting of three fundamental components that remain relevant today:

-
Collection
The first step involves gathering telemetry data from your systems. This includes logs from applications and services, system performance metrics, and traces tracking requests through your infrastructure. Over the past decade, collection methods have evolved significantly, with OpenTelemetry (OTel) emerging as the industry standard. OTel provides vendor-neutral APIs, SDKs, and tools for instrumenting, generating, collecting, and exporting telemetry data. This standardization makes integrating with different storage layers and frontends easier while avoiding vendor lock-in. -
Storage
The storage layer acts as the engine of the observability stack, and its requirements have grown increasingly demanding as systems become more complex. Modern storage solutions need to handle real-time ingestion of ever-growing data volumes while maintaining quick query response times. They must provide efficient compression to manage storage costs, especially as retention requirements grow.The storage layer must also scale horizontally to accommodate growing data volumes and support flexible data retention policies. As organizations collect more telemetry data, the efficiency and capabilities of the storage layer become increasingly critical to the success of their observability strategy.
-
Visualization and Alerting
The presentation layer is where teams interact with their observability data, turning raw telemetry into actionable insights. Modern visualization solutions provide dashboards for monitoring system health and interfaces for investigating issues. Alerting systems help teams proactively detect and respond to problems before they impact users. Tools for log exploration and analysis allow engineers to dive deep into system behavior when troubleshooting issues.The best visualization solutions integrate with various data sources and provide flexible ways to explore and understand system behavior, from high-level overviews to detailed debugging sessions. Many observability vendors offer end-to-end solutions that include all these components, from collection agents and data aggregators to storage and presentation GUIs. However, organizations increasingly choose to build custom pipelines using best-of-breed tools for each component, allowing them to tailor solutions to their specific needs while maintaining control over costs and capabilities.
Out-of-the-box observability solutions #
For small teams lacking expertise in observability, using an out-of-the-box solution can be highly beneficial. These solutions simplify the process by providing pre-configured tools that allow you to visualize and understand what's happening in your system without needing deep technical knowledge. This approach can be an excellent starting point, enabling you to focus on learning and gradually deciding whether to continue with the solution or explore more customized options as your understanding of observability grows.
Out-of-the-box solutions from vendors like Datadog, New Relic, and honeycomb.io offer comprehensive platforms that support data collection, storage, visualization, and alerting. The service provider typically manages these platforms, reducing your team's infrastructure management burden. You may need to perform some basic instrumentation to collect telemetry data, but beyond that, much of the heavy lifting is handled for you.
However, as your organization grows and your observability needs become more complex, you might find that these solutions have limitations regarding customization, scalability, and cost control.
In the past, building your own observability pipeline was often not feasible due to the lack of databases capable of handling the volume and speed at which telemetry data is generated. But now, with the advent of ClickHouse, this is changing.
The SQL-based observability pipeline #
ClickHouse, as a real-time OLAP column store, provides the scalability, speed, and flexibility needed to handle large volumes of observability data efficiently. This makes it a viable option for organizations looking to build their own observability pipelines.
The emergence of open standards and tooling like OpenTelemetry (OTel), Grafana, Fluentd, and Kubernetes further facilitates this transition. If you're already using OTel, integrating ClickHouse as your backend database becomes significantly more straightforward, allowing you to leverage its powerful SQL capabilities for querying and analyzing telemetry data.
By adopting a SQL-based observability pipeline with ClickHouse, teams can benefit from:
- Real-Time Analytics: ClickHouse's ability to process analytical queries at millisecond speeds and ingest millions of rows per second makes it ideal for real-time observability tasks.
- Cost-effectiveness: The combination of efficient data compression and the ability to separate storage and compute helps reduce the total cost of ownership, making it a cost-effective solution for managing large-scale observability data.
- Open standards and interoperability: With support for OpenTelemetry and a wide range of data formats and integrations, ClickHouse ensures that your observability stack remains open and adaptable, avoiding vendor lock-in.
- Customization and control: Building your own pipeline allows for customization to meet specific business needs, providing control over data retention, transformation workflows, and visualization tools.
As organizations seek more tailored and cost-effective observability solutions, the SQL-based approach with ClickHouse presents a robust option that aligns with the evolving landscape of data management and analytics.
ClickHouse's "LogHouse" exemplifies this approach's power and efficiency. Deployed as a centralized logging platform within ClickHouse Cloud, it leverages OpenTelemetry for data collection, ClickHouse Cloud for storage, and Grafana for visualization.
This multi-region setup manages over 10 petabytes of telemetry data and compresses it to just 600 terabytes, achieving a 16x compression ratio. The deployment meets extensive logging requirements and demonstrates substantial cost savings. It is estimated to be 300 times more economical than leading commercial SaaS observability providers. This showcases the potential of SQL-based observability to deliver scalable, cost-effective solutions.
To learn how we built LogHouse, see How we Built a 19 PiB Logging Platform with ClickHouse and Saved Millions. We also have a guide showing how to build your own SQL-based Observability solution using ClickHouse.