跳到主要内容
跳到主要内容

Prometheus 集成

此功能支持集成 Prometheus 以监控 ClickHouse Cloud 服务。通过 ClickHouse Cloud API 提供的 Prometheus 指标端点,您可以安全地连接并将指标导出到 Prometheus 指标采集器。这些指标可以集成到 Grafana、Datadog 等可视化仪表板中。

要开始使用,请先生成一个 API 密钥

用于拉取 ClickHouse Cloud 指标的 Prometheus 端点 API

API 参考

MethodPathDescription
GEThttps://api.clickhouse.cloud/v1/organizations/:organizationId/services/:serviceId/prometheus?filtered_metrics=[true | false]返回指定服务的指标数据
GEThttps://api.clickhouse.cloud/v1/organizations/:organizationId/prometheus?filtered_metrics=[true | false]返回指定组织下所有服务的指标数据

请求参数

NameLocationType
Organization ID端点地址uuid
Service ID端点地址uuid(可选)
filtered_metrics查询参数boolean(可选)

身份验证

使用 ClickHouse Cloud API 密钥进行基本身份验证:

Username: <KEY_ID>
Password: <KEY_SECRET>
Example request
export KEY_SECRET=<key_secret>
export KEY_ID=<key_id>
export ORG_ID=<org_id>

# For all services in $ORG_ID
curl --silent --user $KEY_ID:$KEY_SECRET https://api.clickhouse.cloud/v1/organizations/$ORG_ID/prometheus?filtered_metrics=true

# For a single service only
export SERVICE_ID=<service_id>
curl --silent --user $KEY_ID:$KEY_SECRET https://api.clickhouse.cloud/v1/organizations/$ORG_ID/services/$SERVICE_ID/prometheus?filtered_metrics=true

示例响应

# HELP ClickHouse_ServiceInfo Information about service, including cluster status and ClickHouse version
# TYPE ClickHouse_ServiceInfo untyped
ClickHouse_ServiceInfo{clickhouse_org="c2ba4799-a76e-456f-a71a-b021b1fafe60",clickhouse_service="12f4a114-9746-4a75-9ce5-161ec3a73c4c",clickhouse_service_name="test service",clickhouse_cluster_status="running",clickhouse_version="24.5",scrape="full"} 1

# HELP ClickHouseProfileEvents_Query Number of queries to be interpreted and potentially executed. Does not include queries that failed to parse or were rejected due to AST size limits, quota limits or limits on the number of simultaneously running queries. May include internal queries initiated by ClickHouse itself. Does not count subqueries.
# TYPE ClickHouseProfileEvents_Query counter
ClickHouseProfileEvents_Query{clickhouse_org="c2ba4799-a76e-456f-a71a-b021b1fafe60",clickhouse_service="12f4a114-9746-4a75-9ce5-161ec3a73c4c",clickhouse_service_name="test service",hostname="c-cream-ma-20-server-3vd2ehh-0",instance="c-cream-ma-20-server-3vd2ehh-0",table="system.events"} 6

# HELP ClickHouseProfileEvents_QueriesWithSubqueries Count queries with all subqueries
# TYPE ClickHouseProfileEvents_QueriesWithSubqueries counter
ClickHouseProfileEvents_QueriesWithSubqueries{clickhouse_org="c2ba4799-a76e-456f-a71a-b021b1fafe60",clickhouse_service="12f4a114-9746-4a75-9ce5-161ec3a73c4c",clickhouse_service_name="test service",hostname="c-cream-ma-20-server-3vd2ehh-0",instance="c-cream-ma-20-server-3vd2ehh-0",table="system.events"} 230

# HELP ClickHouseProfileEvents_SelectQueriesWithSubqueries Count SELECT queries with all subqueries
# TYPE ClickHouseProfileEvents_SelectQueriesWithSubqueries counter
ClickHouseProfileEvents_SelectQueriesWithSubqueries{clickhouse_org="c2ba4799-a76e-456f-a71a-b021b1fafe60",clickhouse_service="12f4a114-9746-4a75-9ce5-161ec3a73c4c",clickhouse_service_name="test service",hostname="c-cream-ma-20-server-3vd2ehh-0",instance="c-cream-ma-20-server-3vd2ehh-0",table="system.events"} 224

# HELP ClickHouseProfileEvents_FileOpen Number of files opened.
# TYPE ClickHouseProfileEvents_FileOpen counter
ClickHouseProfileEvents_FileOpen{clickhouse_org="c2ba4799-a76e-456f-a71a-b021b1fafe60",clickhouse_service="12f4a114-9746-4a75-9ce5-161ec3a73c4c",clickhouse_service_name="test service",hostname="c-cream-ma-20-server-3vd2ehh-0",instance="c-cream-ma-20-server-3vd2ehh-0",table="system.events"} 4157

# HELP ClickHouseProfileEvents_Seek Number of times the 'lseek' function was called.
# TYPE ClickHouseProfileEvents_Seek counter
ClickHouseProfileEvents_Seek{clickhouse_org="c2ba4799-a76e-456f-a71a-b021b1fafe60",clickhouse_service="12f4a114-9746-4a75-9ce5-161ec3a73c4c",clickhouse_service_name="test service",hostname="c-cream-ma-20-server-3vd2ehh-0",instance="c-cream-ma-20-server-3vd2ehh-0",table="system.events"} 1840

# HELP ClickPipes_Info Always equal to 1. Label "clickpipe_state" contains the current state of the pipe: Stopped/Provisioning/Running/Paused/Failed
# TYPE ClickPipes_Info gauge
ClickPipes_Info{clickhouse_org="11dfa1ec-767d-43cb-bfad-618ce2aaf959",clickhouse_service="82b83b6a-5568-4a82-aa78-fed9239db83f",clickhouse_service_name="ClickPipes demo instace",clickpipe_id="642bb967-940b-459e-9f63-a2833f62ec44",clickpipe_name="Confluent demo pipe",clickpipe_source="confluent",clickpipe_status="Running"} 1

# HELP ClickPipes_SentEvents_Total Total number of records sent to ClickHouse
# TYPE ClickPipes_SentEvents_Total counter
ClickPipes_SentEvents_Total{clickhouse_org="11dfa1ec-767d-43cb-bfad-618ce2aaf959",clickhouse_service="82b83b6a-5568-4a82-aa78-fed9239db83f",clickhouse_service_name="ClickPipes demo instace",clickpipe_id="642bb967-940b-459e-9f63-a2833f62ec44",clickpipe_name="Confluent demo pipe",clickpipe_source="confluent"} 5534250

# HELP ClickPipes_SentBytesCompressed_Total Total compressed bytes sent to ClickHouse.
# TYPE ClickPipes_SentBytesCompressed_Total counter
ClickPipes_SentBytesCompressed_Total{clickhouse_org="11dfa1ec-767d-43cb-bfad-618ce2aaf959",clickhouse_service="82b83b6a-5568-4a82-aa78-fed9239db83f",clickhouse_service_name
="ClickPipes demo instace",clickpipe_id="642bb967-940b-459e-9f63-a2833f62ec44",clickpipe_name="Confluent demo pipe",clickpipe_source="confluent"} 380837520
ClickPipes_SentBytesCompressed_Total{clickhouse_org="11dfa1ec-767d-43cb-bfad-618ce2aaf959",clickhouse_service="82b83b6a-5568-4a82-aa78-fed9239db83f",clickhouse_service_name

# HELP ClickPipes_FetchedBytes_Total Total uncompressed bytes fetched from the source.
# TYPE ClickPipes_FetchedBytes_Total counter
ClickPipes_FetchedBytes_Total{clickhouse_org="11dfa1ec-767d-43cb-bfad-618ce2aaf959",clickhouse_service="82b83b6a-5568-4a82-aa78-fed9239db83f",clickhouse_service_name="ClickPipes demo instace",clickpipe_id="642bb967-940b-459e-9f63-a2833f62ec44",clickpipe_name="Confluent demo pipe",clickpipe_source="confluent"} 873286202

# HELP ClickPipes_Errors_Total Total errors ingesting data.
# TYPE ClickPipes_Errors_Total counter
ClickPipes_Errors_Total{clickhouse_org="11dfa1ec-767d-43cb-bfad-618ce2aaf959",clickhouse_service="82b83b6a-5568-4a82-aa78-fed9239db83f",clickhouse_service_name="ClickPipes demo instace",clickpipe_id="642bb967-940b-459e-9f63-a2833f62ec44",clickpipe_name="Confluent demo pipe",clickpipe_source="confluent"} 0

# HELP ClickPipes_SentBytes_Total Total uncompressed bytes sent to ClickHouse.
# TYPE ClickPipes_SentBytes_Total counter
ClickPipes_SentBytes_Total{clickhouse_org="11dfa1ec-767d-43cb-bfad-618ce2aaf959",clickhouse_service="82b83b6a-5568-4a82-aa78-fed9239db83f",clickhouse_service_name="ClickPipes demo instace",clickpipe_id="642bb967-940b-459e-9f63-a2833f62ec44",clickpipe_name="Confluent demo pipe",clickpipe_source="confluent"} 477187967

# HELP ClickPipes_FetchedBytesCompressed_Total Total compressed bytes fetched from the source. If data is uncompressed at the source, this will equal ClickPipes_FetchedBytes_Total
# TYPE ClickPipes_FetchedBytesCompressed_Total counter
ClickPipes_FetchedBytesCompressed_Total{clickhouse_org="11dfa1ec-767d-43cb-bfad-618ce2aaf959",clickhouse_service="82b83b6a-5568-4a82-aa78-fed9239db83f",clickhouse_service_name="ClickPipes demo instace",clickpipe_id="642bb967-940b-459e-9f63-a2833f62ec44",clickpipe_name="Confluent demo pipe",clickpipe_source="confluent"} 873286202

# HELP ClickPipes_FetchedEvents_Total Total number of records fetched from the source.
# TYPE ClickPipes_FetchedEvents_Total counter
ClickPipes_FetchedEvents_Total{clickhouse_org="11dfa1ec-767d-43cb-bfad-618ce2aaf959",clickhouse_service="82b83b6a-5568-4a82-aa78-fed9239db83f",clickhouse_service_name="ClickPipes demo instace",clickpipe_id="642bb967-940b-459e-9f63-a2833f62ec44",clickpipe_name="Confluent demo pipe",clickpipe_source="confluent"} 5535376

指标标签

所有指标都包含以下标签:

标签说明
clickhouse_org组织 ID
clickhouse_service服务 ID
clickhouse_service_name服务名称

对于 ClickPipes,指标还将包含以下标签:

标签说明
clickpipe_idClickPipe ID
clickpipe_nameClickPipe 名称
clickpipe_sourceClickPipe 源类型

信息指标

ClickHouse Cloud 提供了一个特殊的指标 ClickHouse_ServiceInfo,它是一个 gauge 类型指标,其值始终为 1。该指标包含所有 Metric Labels,以及以下标签:

LabelDescription
clickhouse_cluster_status服务的状态,可能为以下之一:[awaking | running | degraded | idle | stopped]
clickhouse_version服务当前运行的 ClickHouse 服务器版本
scrape指示最近一次抓取的状态,可能为 fullpartial
full指示最近一次指标抓取过程中没有发生错误
partial指示最近一次指标抓取过程中存在错误,并且只返回了 ClickHouse_ServiceInfo 指标。

用于获取指标的请求不会唤醒处于空闲状态的服务。如果服务处于 idle 状态,将只返回 ClickHouse_ServiceInfo 指标。

对于 ClickPipes,有一个类似的 ClickPipes_Info gauge 指标,除了 Metric Labels 之外,还包含以下标签:

LabelDescription
clickpipe_state当前管道的状态

配置 Prometheus

Prometheus 服务器会按指定的时间间隔从已配置的目标中收集指标。下面是一个 Prometheus 服务器的示例配置,用于对接 ClickHouse Cloud 的 Prometheus Endpoint:

global:
  scrape_interval: 15s

scrape_configs:
  - job_name: "prometheus"
    static_configs:
    - targets: ["localhost:9090"]
  - job_name: "clickhouse"
    static_configs:
      - targets: ["api.clickhouse.cloud"]
    scheme: https
    params:
      filtered_metrics: ["true"]
    metrics_path: "/v1/organizations/<ORG_ID>/prometheus"
    basic_auth:
      username: <KEY_ID>
      password: <KEY_SECRET>
    honor_labels: true

请注意,需要将 honor_labels 配置参数设置为 true,才能正确填充 instance 标签。另 外,在上述示例中 filtered_metrics 被设置为 true,但应根据用户的偏好和需求进行配置。

集成 Grafana

用户可以通过两种主要方式与 Grafana 集成:

  • Metrics Endpoint – 这种方式的优点是不需要任何额外组件或基础设施。该方案仅适用于 Grafana Cloud,只需要 ClickHouse Cloud Prometheus Endpoint 的 URL 和凭证。
  • Grafana Alloy - Grafana Alloy 是与厂商无关的 OpenTelemetry (OTel) Collector 发行版,用于替代 Grafana Agent。它可以用作抓取器,可部署在您自己的基础设施中,并与任何 Prometheus Endpoint 兼容。

下面我们提供使用这些选项的说明,重点介绍与 ClickHouse Cloud Prometheus Endpoint 相关的具体细节。

使用 metrics endpoint 的 Grafana Cloud

  • 登录到你的 Grafana Cloud 账户
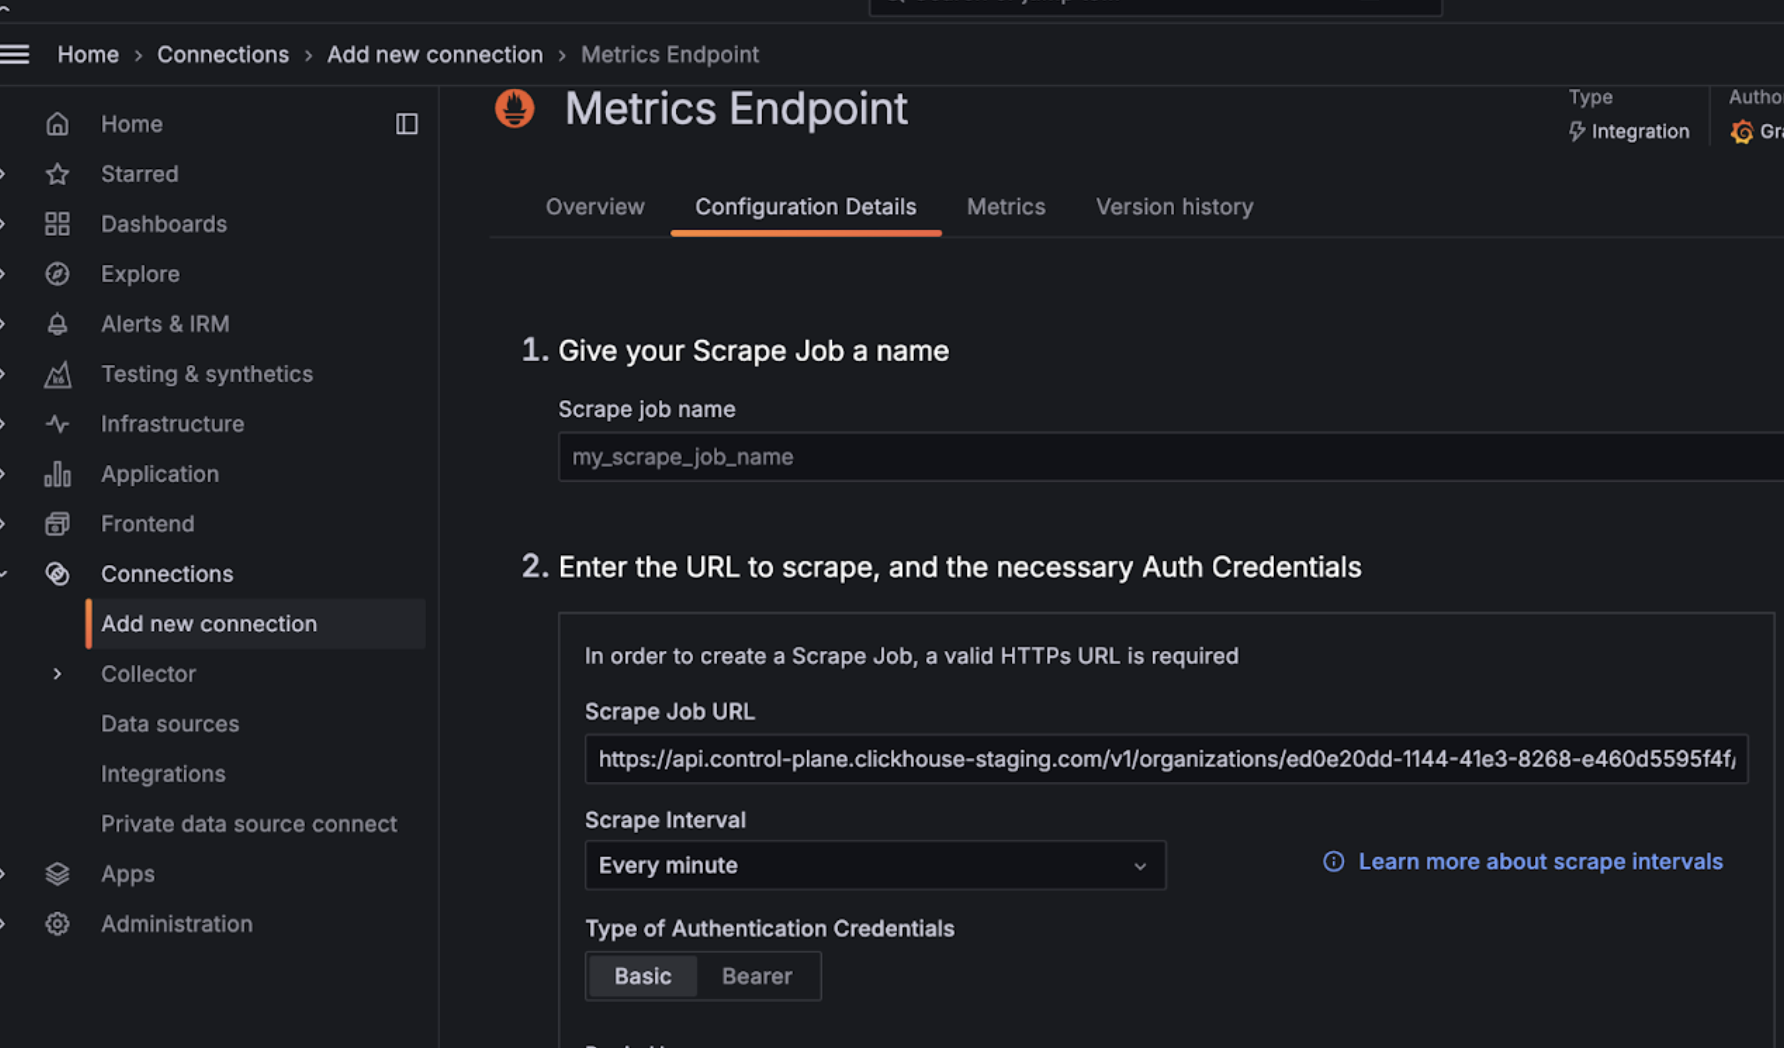
  • 选择 Metrics Endpoint 以添加一个新的连接
  • 将 Scrape URL 配置为指向 Prometheus endpoint,并使用 basic auth 结合 API key/secret 配置连接
  • 测试连接以确保可以正常连通
配置 Grafana Metrics Endpoint

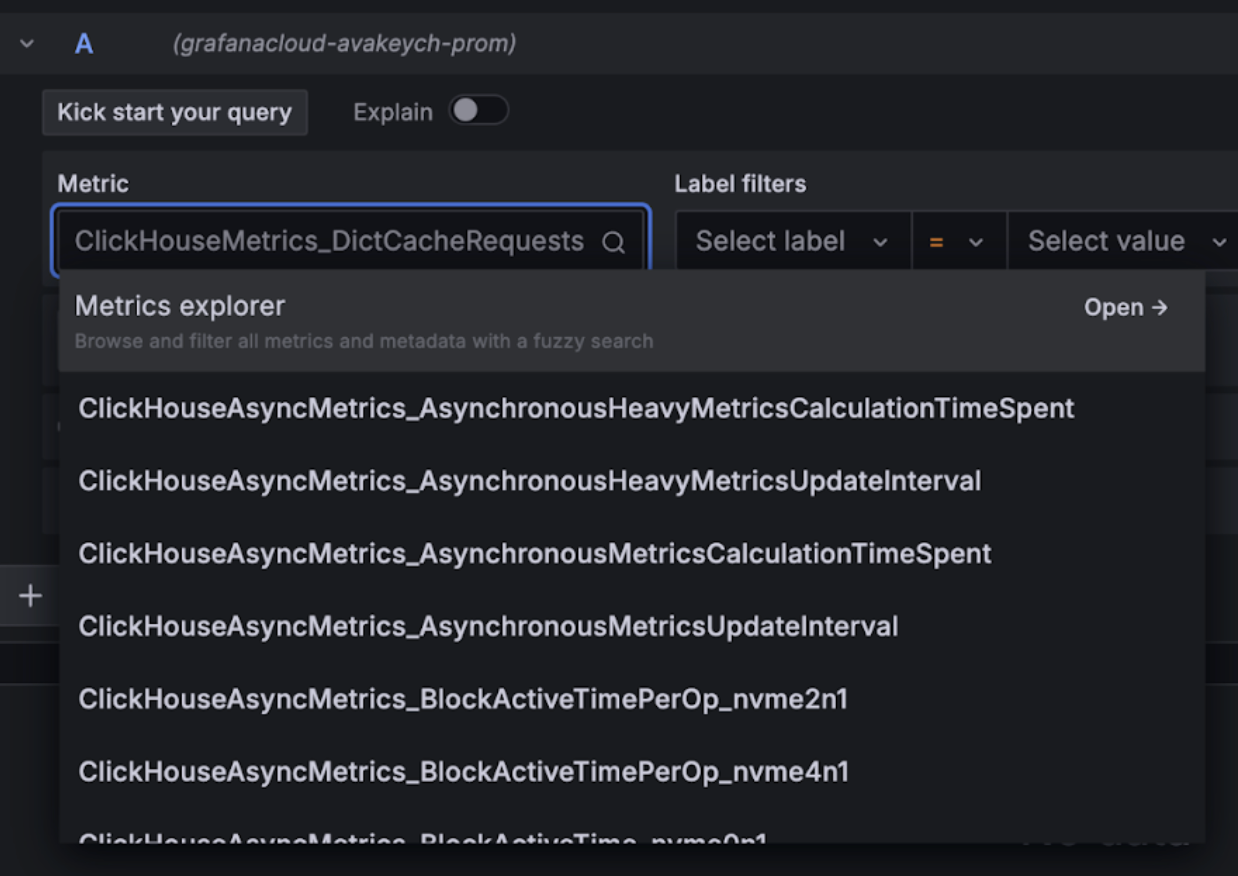
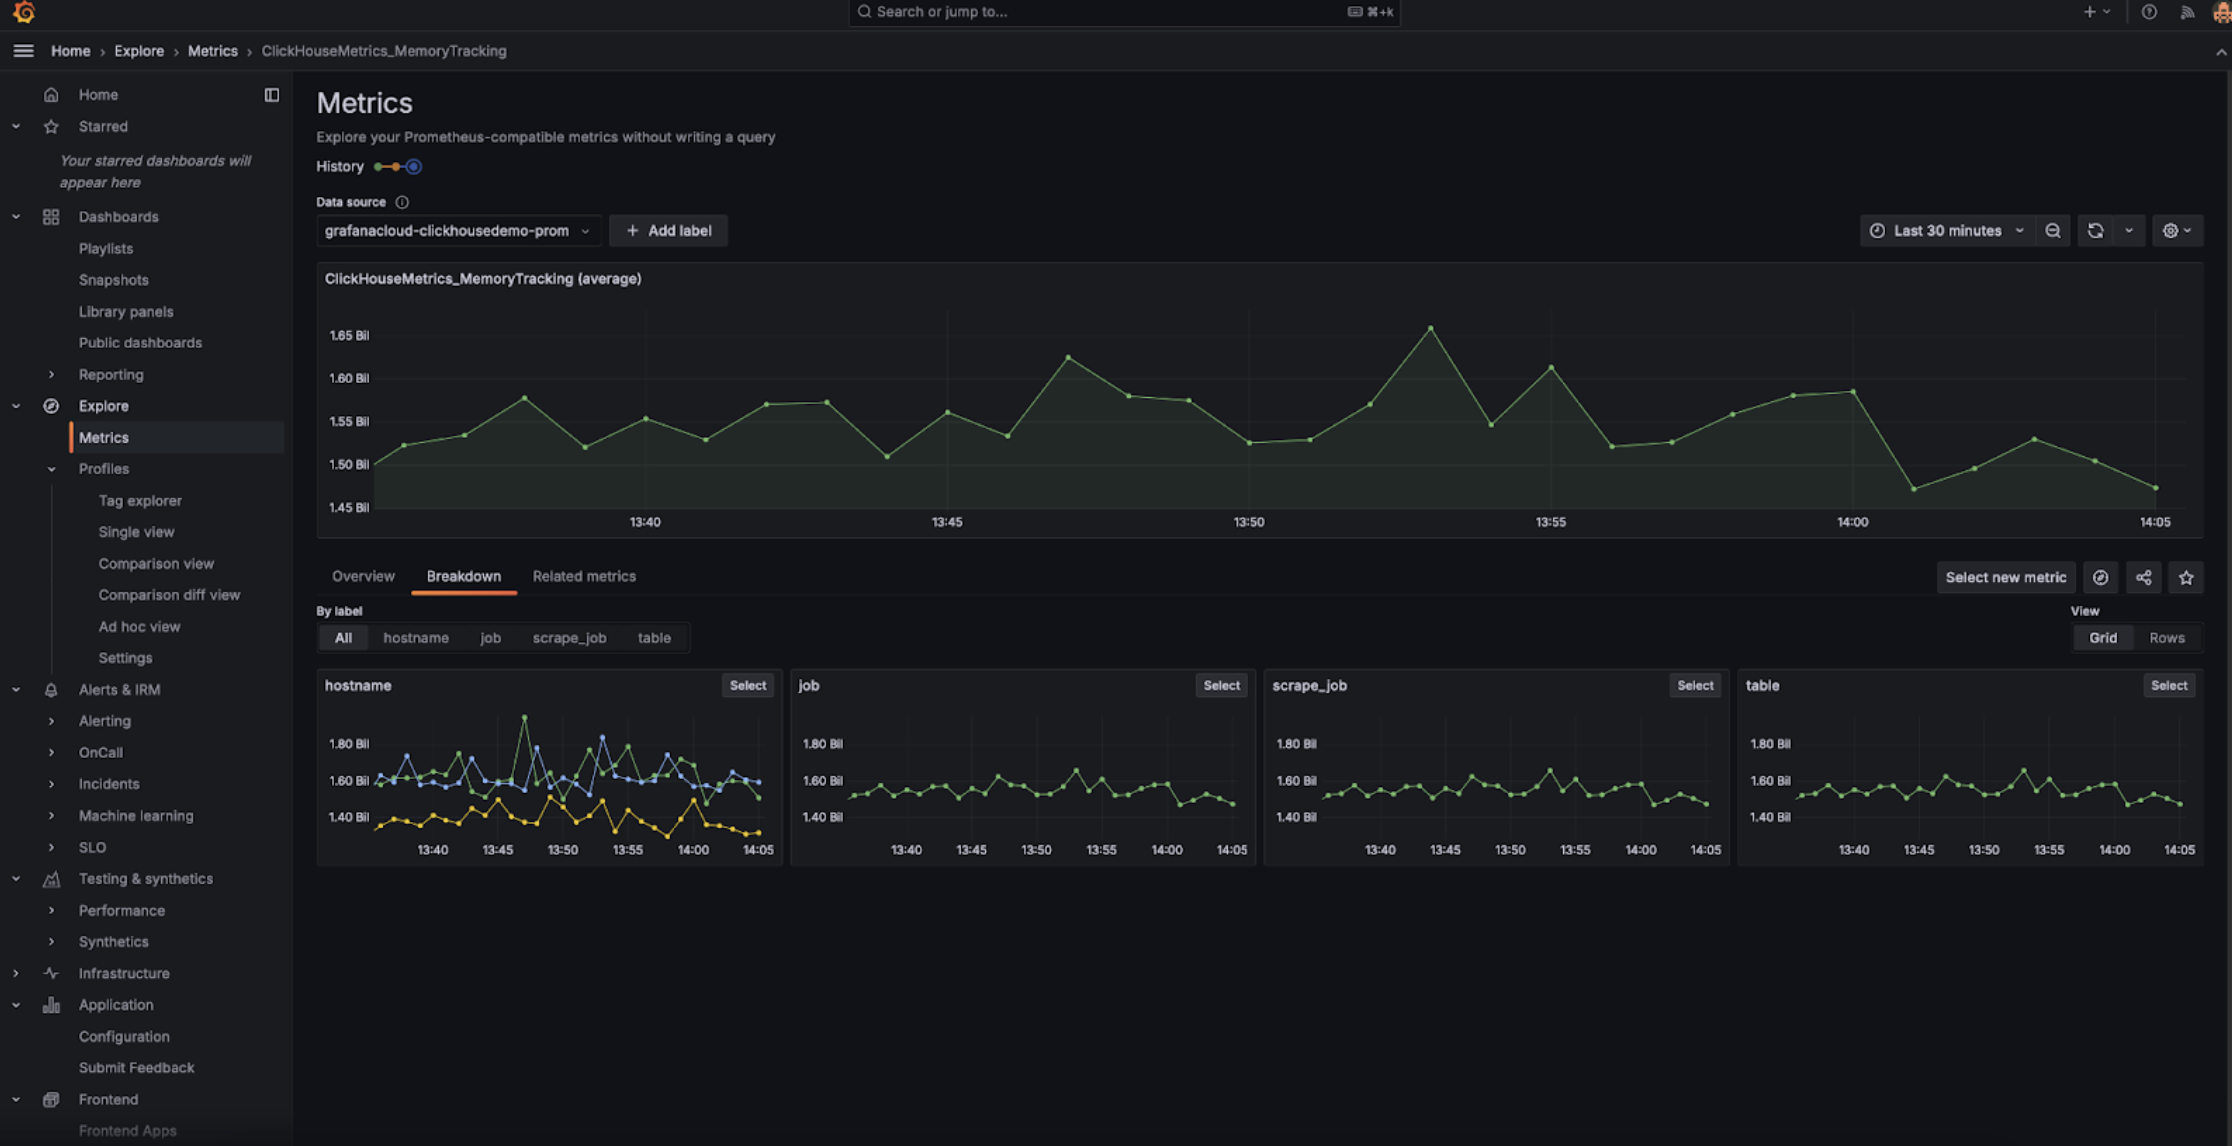
配置完成后,你应该可以在下拉菜单中看到可用于配置 dashboards 的 metrics:

Grafana Metrics Explorer 下拉菜单

Grafana Metrics Explorer 图表

使用 Grafana Cloud 搭配 Alloy

如果您使用 Grafana Cloud,可以在 Grafana 中进入 Alloy 菜单,并按照屏幕上的指引安装 Alloy:

Grafana Alloy

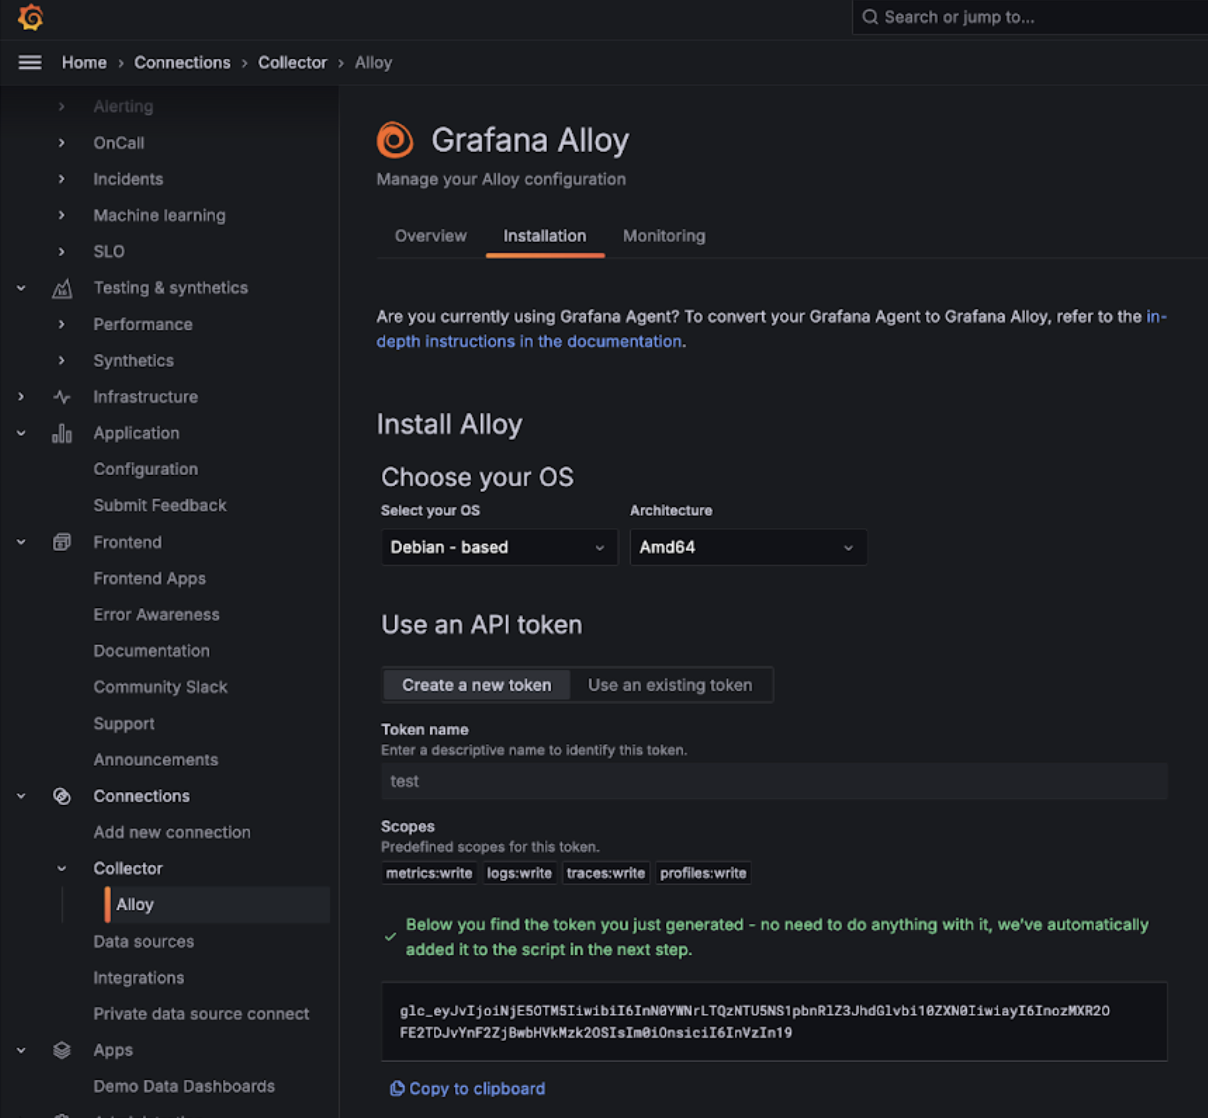
这会将 Alloy 配置为使用 prometheus.remote_write 组件,通过认证令牌将数据发送到 Grafana Cloud 端点。之后,用户只需要修改 Alloy 配置(在 Linux 上位于 /etc/alloy/config.alloy),以添加一个用于抓取 ClickHouse Cloud Prometheus 端点的 scraper。

下面是一个 Alloy 配置示例,其中包含一个用于从 ClickHouse Cloud 端点抓取指标的 prometheus.scrape 组件,以及自动配置好的 prometheus.remote_write 组件。请注意,basic_auth 配置组件中分别将 Cloud API key ID 和 secret 用作用户名和密码。

prometheus.scrape "clickhouse_cloud" {
  // Collect metrics from the default listen address.
  targets = [{
        __address__ = "https://api.clickhouse.cloud/v1/organizations/:organizationId/prometheus?filtered_metrics=true",
// e.g. https://api.clickhouse.cloud/v1/organizations/97a33bdb-4db3-4067-b14f-ce40f621aae1/prometheus?filtered_metrics=true
  }]

  honor_labels = true

  basic_auth {
        username = "KEY_ID"
        password = "KEY_SECRET"
  }

  forward_to = [prometheus.remote_write.metrics_service.receiver]
  // forward to metrics_service below
}

prometheus.remote_write "metrics_service" {
  endpoint {
        url = "https://prometheus-prod-10-prod-us-central-0.grafana.net/api/prom/push"
        basic_auth {
          username = "<Grafana API username>"
          password = "<grafana API token>"
    }
  }
}

请注意,需要将 honor_labels 配置参数设置为 true,才能正确填充 instance 标签的值。

使用 Alloy 的自管理 Grafana

Grafana 的自管理用户可以在此处找到安装 Alloy agent 的说明。我们假设用户已经将 Alloy 配置为将 Prometheus 指标发送到其期望的目标端。下面的 prometheus.scrape 组件会使 Alloy 抓取 ClickHouse Cloud 端点的指标。我们假设 prometheus.remote_write 会接收这些被抓取的指标。如果没有该目标,请将 forward_to 键调整为目标端。

prometheus.scrape "clickhouse_cloud" {
  // Collect metrics from the default listen address.
  targets = [{
        __address__ = "https://api.clickhouse.cloud/v1/organizations/:organizationId/prometheus?filtered_metrics=true",
// e.g. https://api.clickhouse.cloud/v1/organizations/97a33bdb-4db3-4067-b14f-ce40f621aae1/prometheus?filtered_metrics=true
  }]

  honor_labels = true

  basic_auth {
        username = "KEY_ID"
        password = "KEY_SECRET"
  }

  forward_to = [prometheus.remote_write.metrics_service.receiver]
  // forward to metrics_service. Modify to your preferred receiver
}

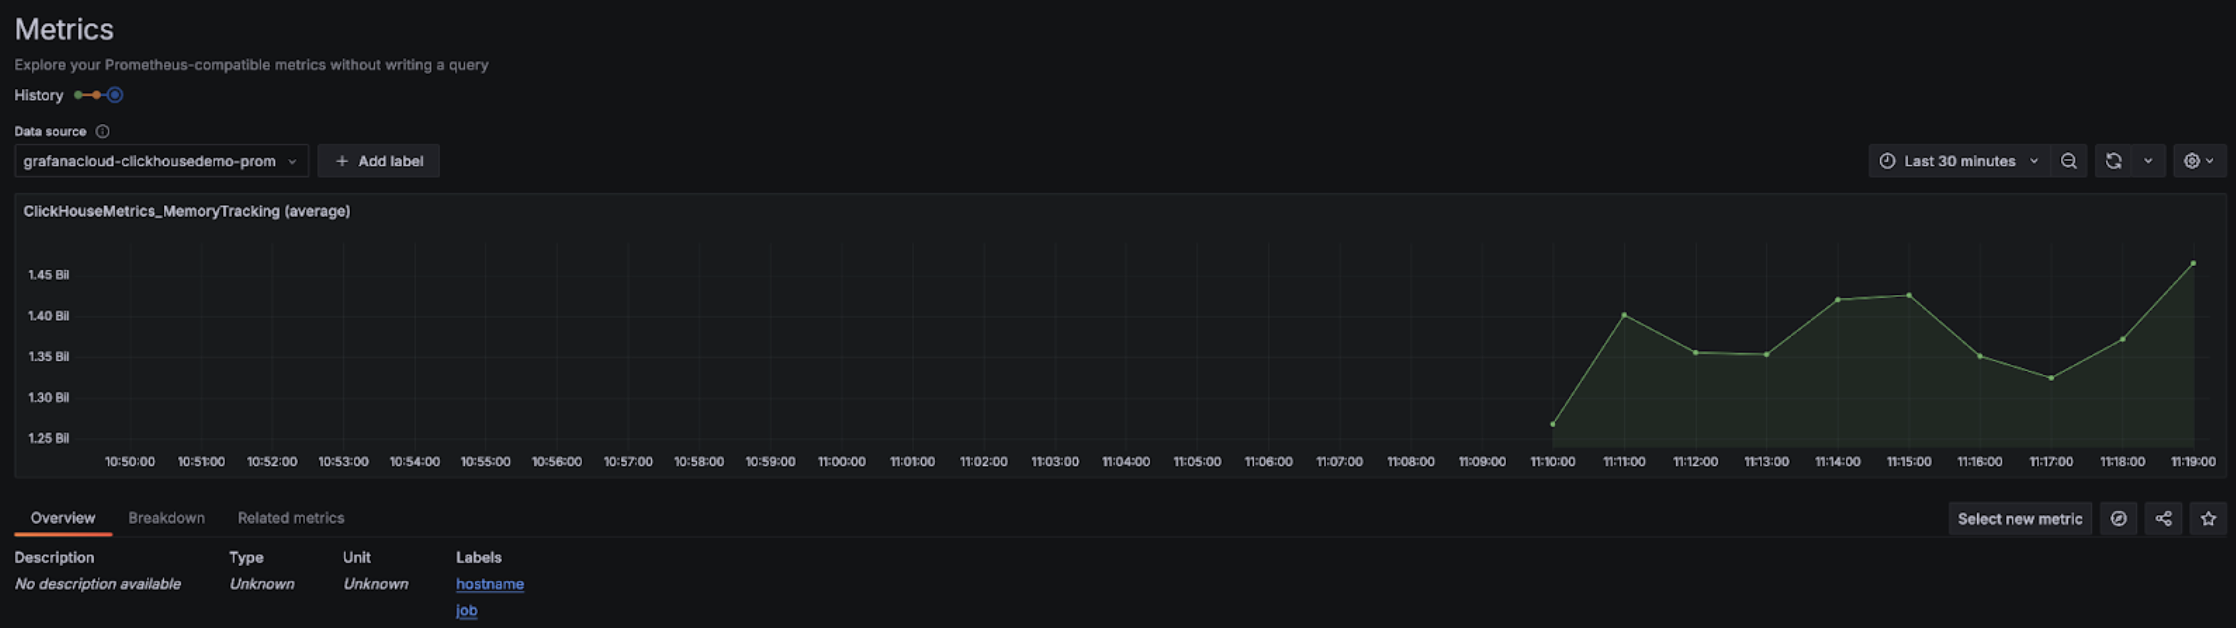
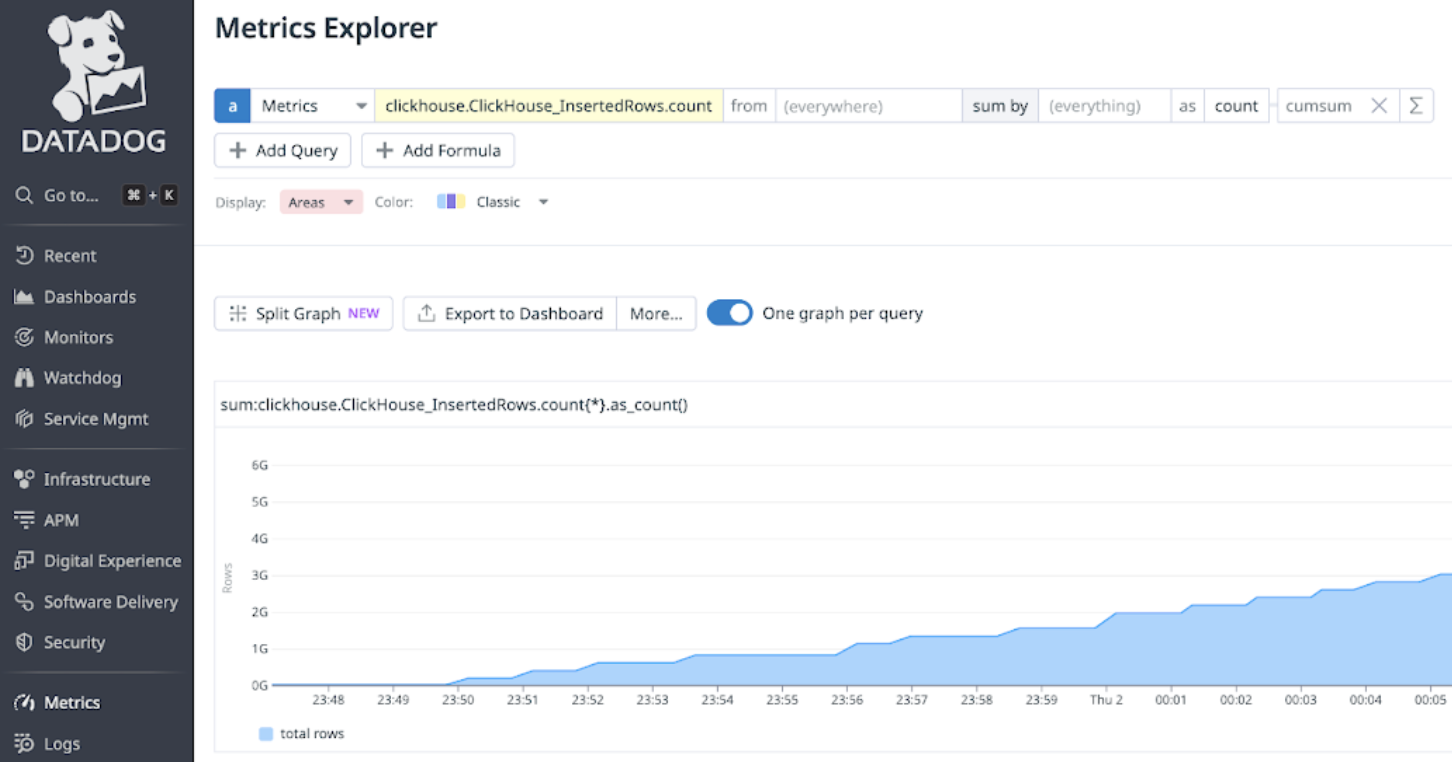
完成配置后,你应该能在 Metrics Explorer 中看到与 ClickHouse 相关的指标:

Grafana Metrics Explorer

请注意,需要将 honor_labels 配置参数设置为 true,才能正确写入 instance 标签。

与 Datadog 集成

可以使用 Datadog 的 AgentOpenMetrics 集成 从 ClickHouse Cloud 端点采集指标。下面是该 Agent 和集成的一个简单示例配置。请注意,实际使用时可能只需要选择对自己最重要的那部分指标。下面这个兜底式示例会导出成千上万种指标与实例的组合,Datadog 会将这些视为自定义指标。

init_config:

instances:
   - openmetrics_endpoint: 'https://api.clickhouse.cloud/v1/organizations/97a33bdb-4db3-4067-b14f-ce40f621aae1/prometheus?filtered_metrics=true'
     namespace: 'clickhouse'
     metrics:
         - '^ClickHouse.*'
     username: username
     password: password

Prometheus 与 Datadog 的集成