 50.9k


Faster investigations
Give engineers and agents fast searches and aggregations across high-cardinality telemetry, with concurrent queries to explore possible causes in parallel.
ClickHouse Observability is the turnkey, fully managed observability solution for SREs and their agents, powered by open source ClickStack. Investigate full-fidelity telemetry with fast, concurrent queries and familiar SQL, while we handle ingestion, storage, optimization, and scaling.
Splunk Enterprise and Splunk Cloud Platform share search capacity; investigations can queue and scheduled alert searches can be skipped when concurrency limits are reached.
ClickHouse Observability automatically scales query compute independently of ingestion, keeping SREs and agents investigating across full-fidelity telemetry and long-term history.
Give engineers and agents fast searches and aggregations across high-cardinality telemetry, with concurrent queries to explore possible causes in parallel.

Columnar compression reduces storage requirements and the data queries need to read, making longer retention affordable so investigations can uncover recurring failures and compare historical behavior.

Join signals, compare deployments, and calculate trends using expressive SQL, without making Splunk-specific query knowledge a prerequisite.

Powered by open source ClickStack, with OpenTelemetry, SQL, and MCP connecting your telemetry, tools, and agents.
Send logs, metrics, and traces from your OpenTelemetry SDKs and collectors to one managed endpoint. Keep the high-cardinality detail your investigations need while we handle schemas, storage, optimization, and scaling.

Investigation tools
Pay by the uncompressed GB for logs, traces, and session replays, and by the million data points for metrics. Estimate costs from the telemetry you send.
Logs, traces, and session replays
Per uncompressed GB ingested
$0.10 / GBGA rate $0.20
Metrics
Per million data points ingested
$0.05 / millionGA rate $0.10
30 days of retention included. No monthly minimum. No separate metrics cardinality charge.
Splunk's billing model varies by product and subscription, including ingest, workload, activity-based, and entity-based pricing. On Splunk Observability Cloud's host- and MTS-based plans, custom metrics are metered by time series, so higher cardinality can increase charges.
An older incident can become today's investigation. ClickHouse Observability keeps retained telemetry searchable in object storage, loading and caching the data each query needs without manual restoration. Splunk data moved into Dynamic Data Active Archive must be restored before searching, adding steps and delays when SREs and agents need historical context.
Optional archive
Splunk Dynamic Data Active Archive

ClickHouse Observability
No storage tiers to manage
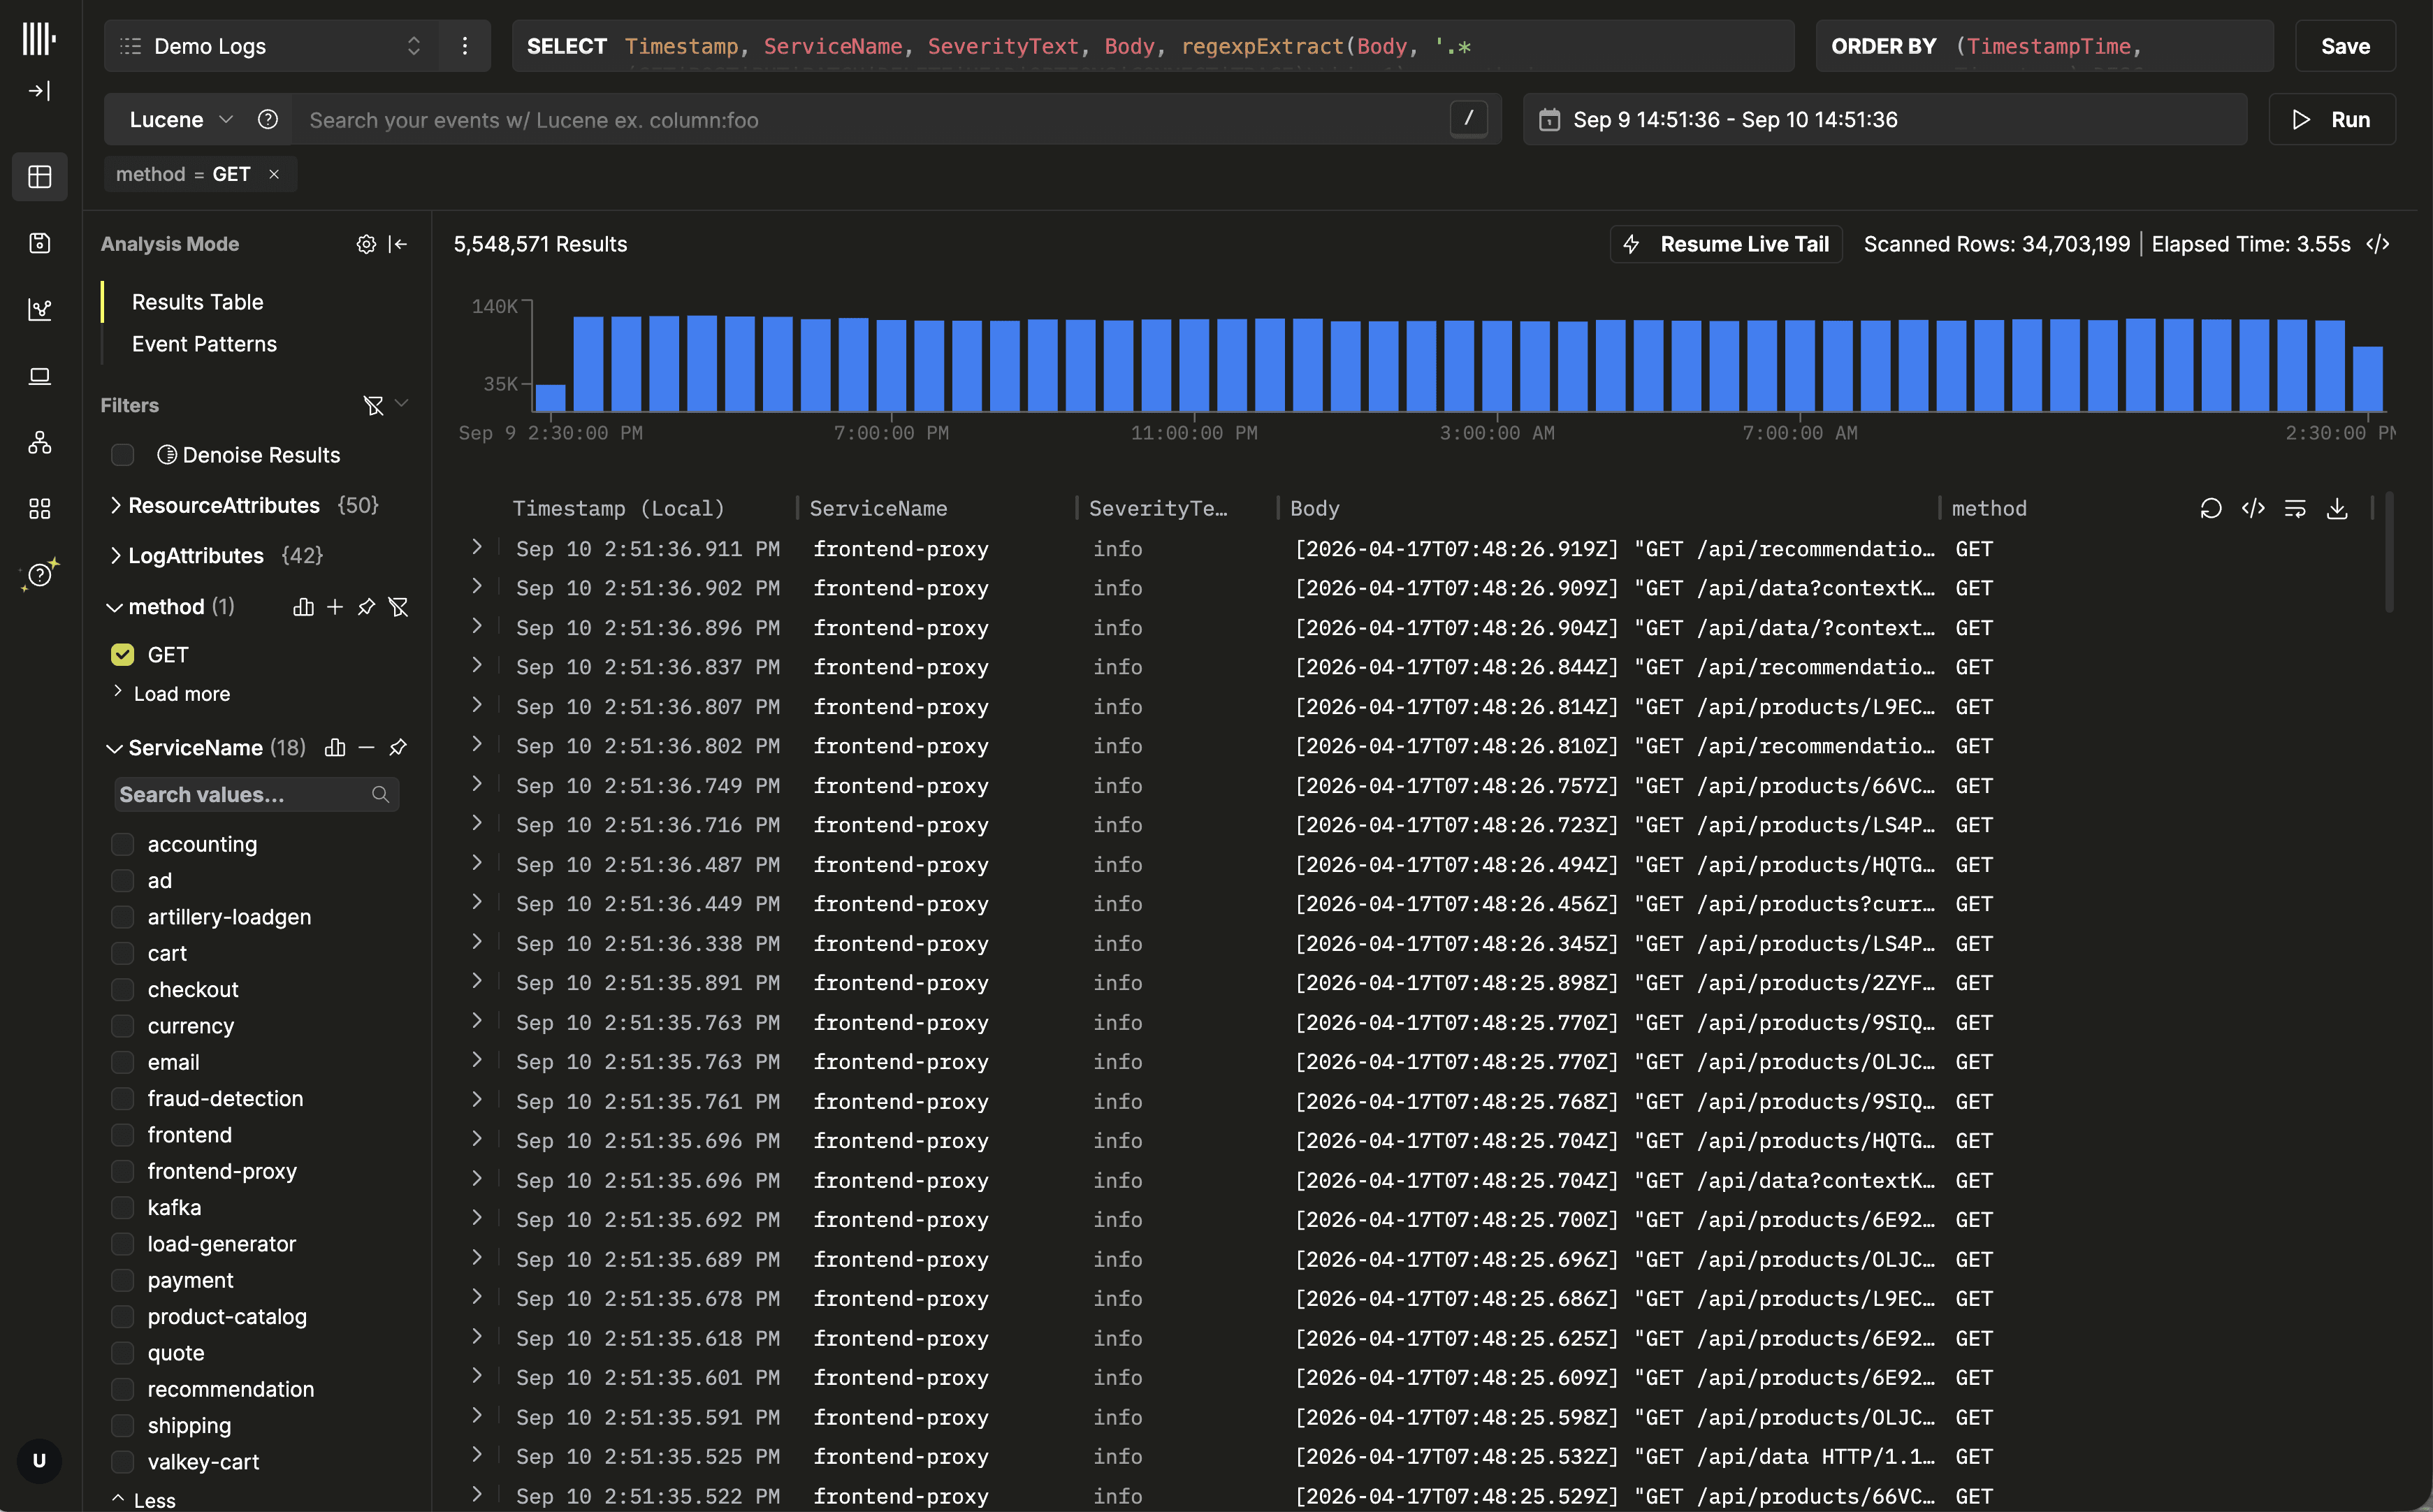
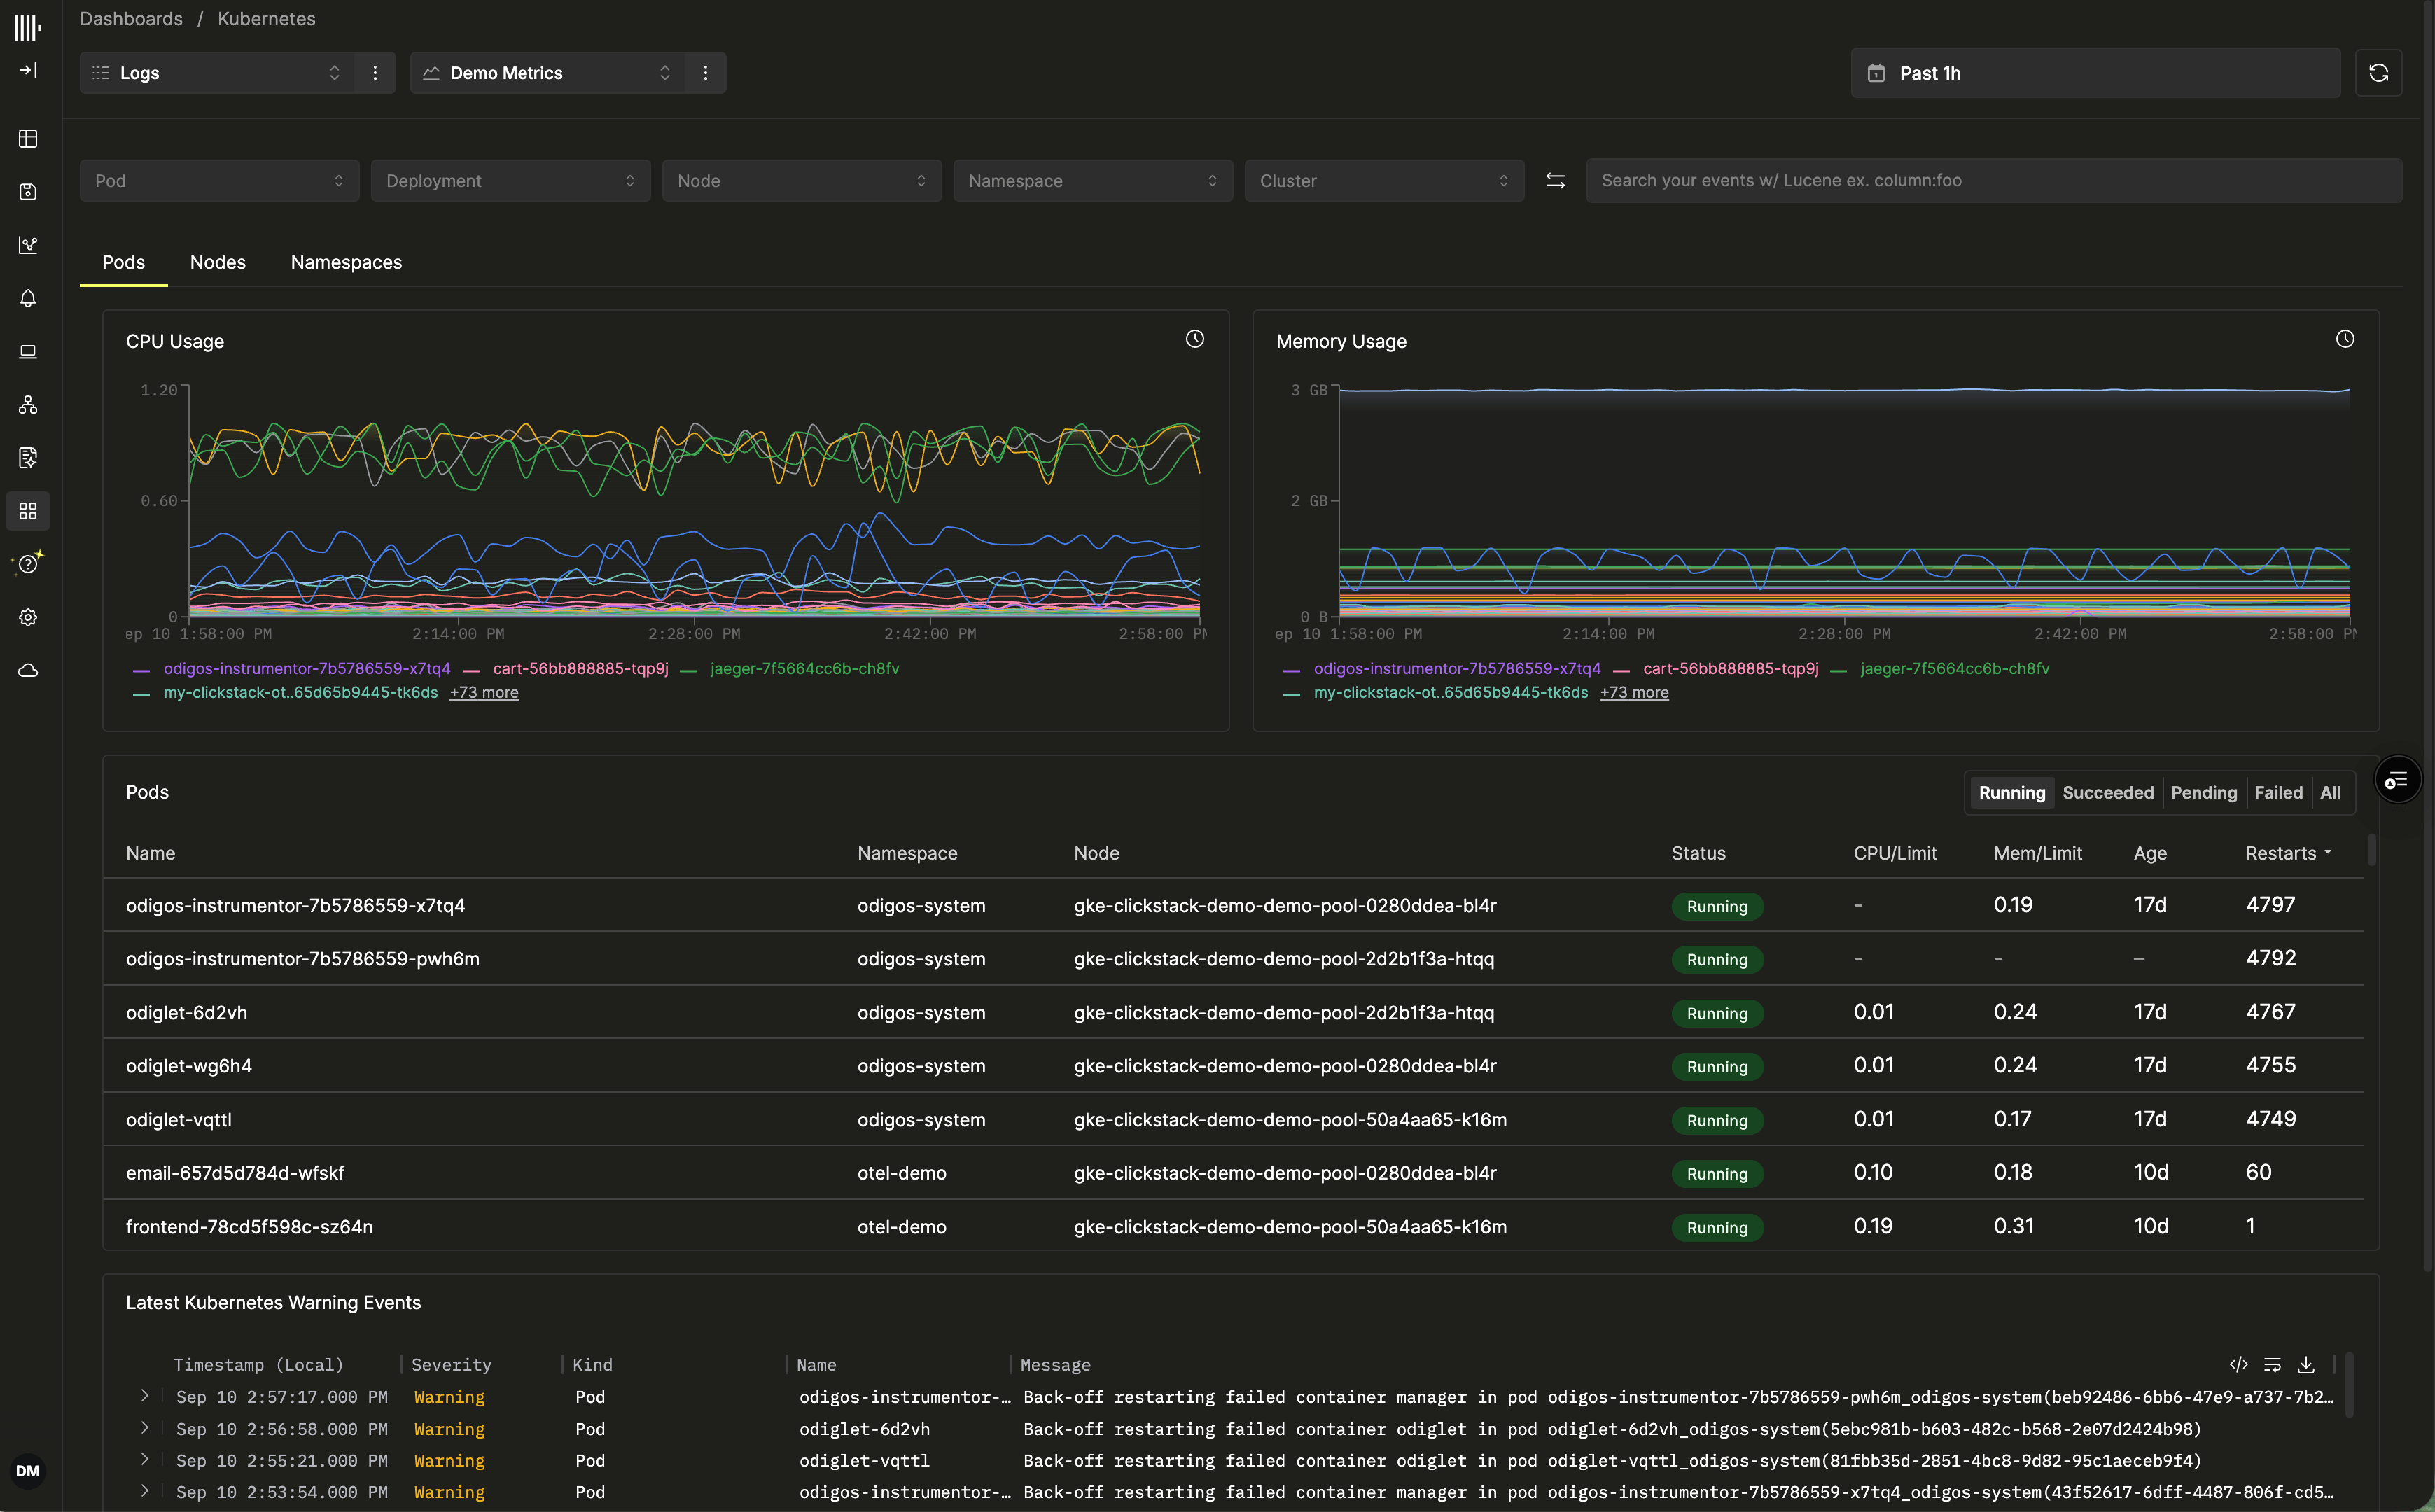
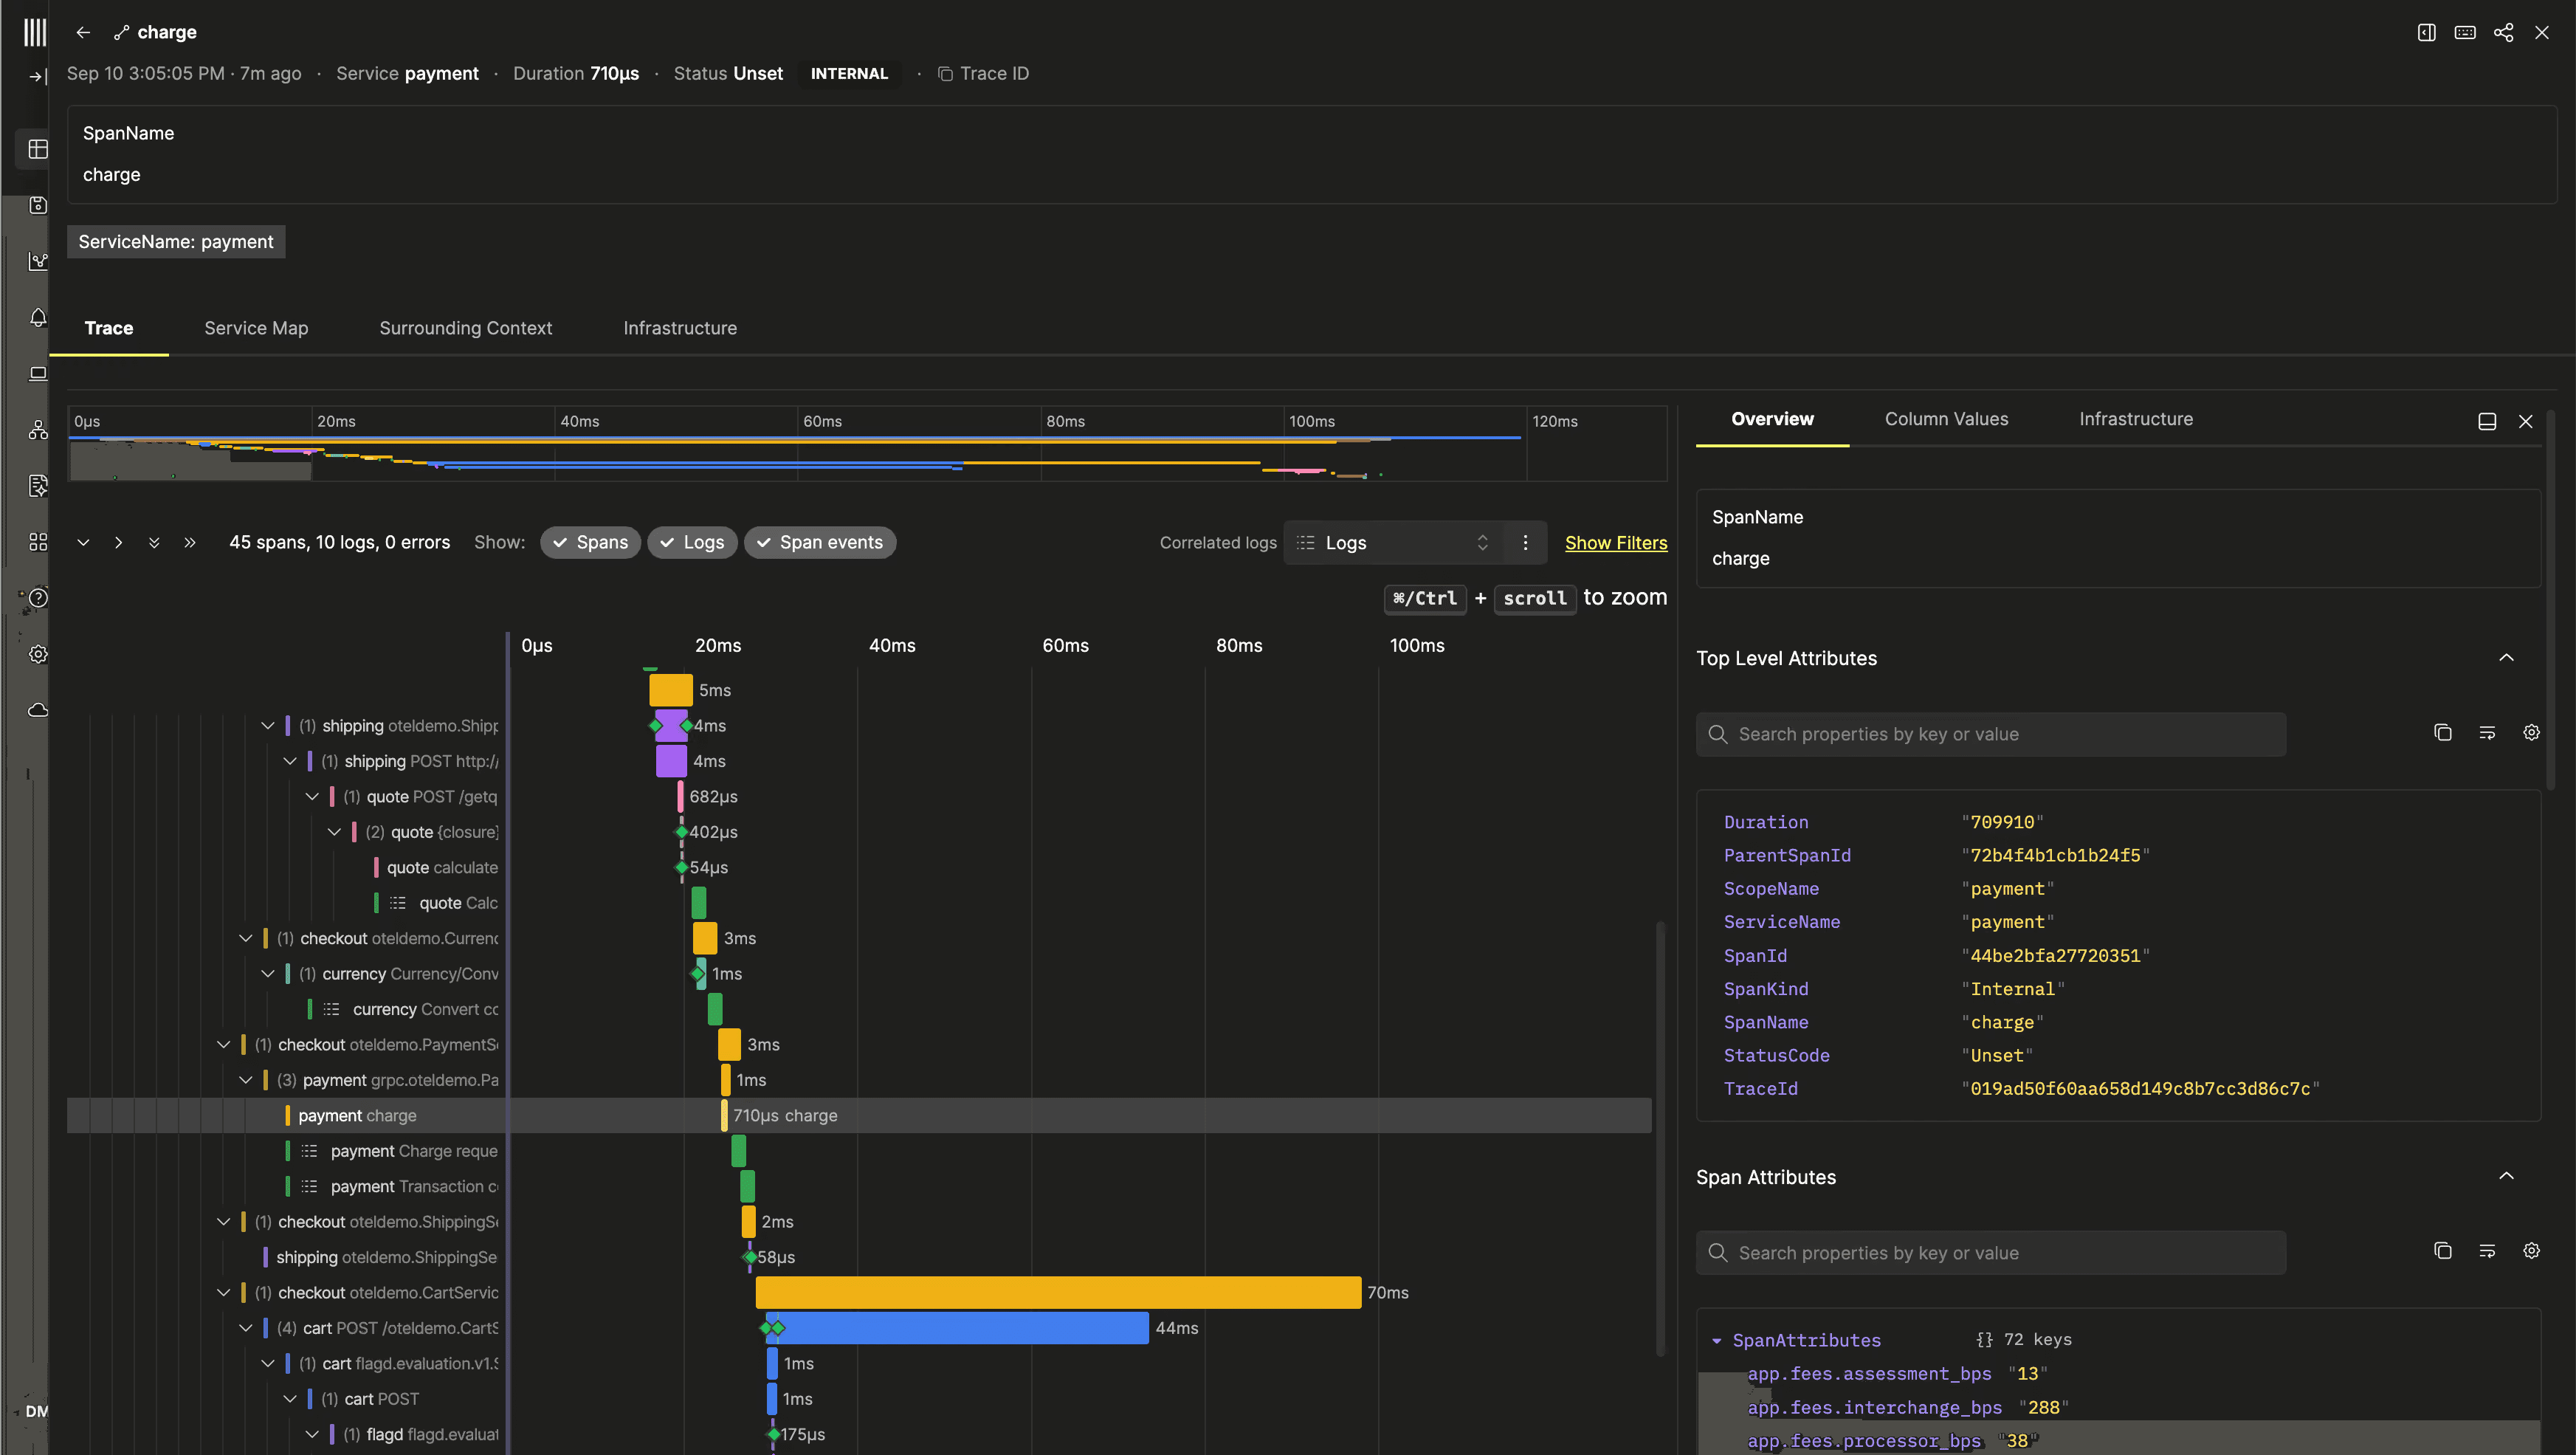
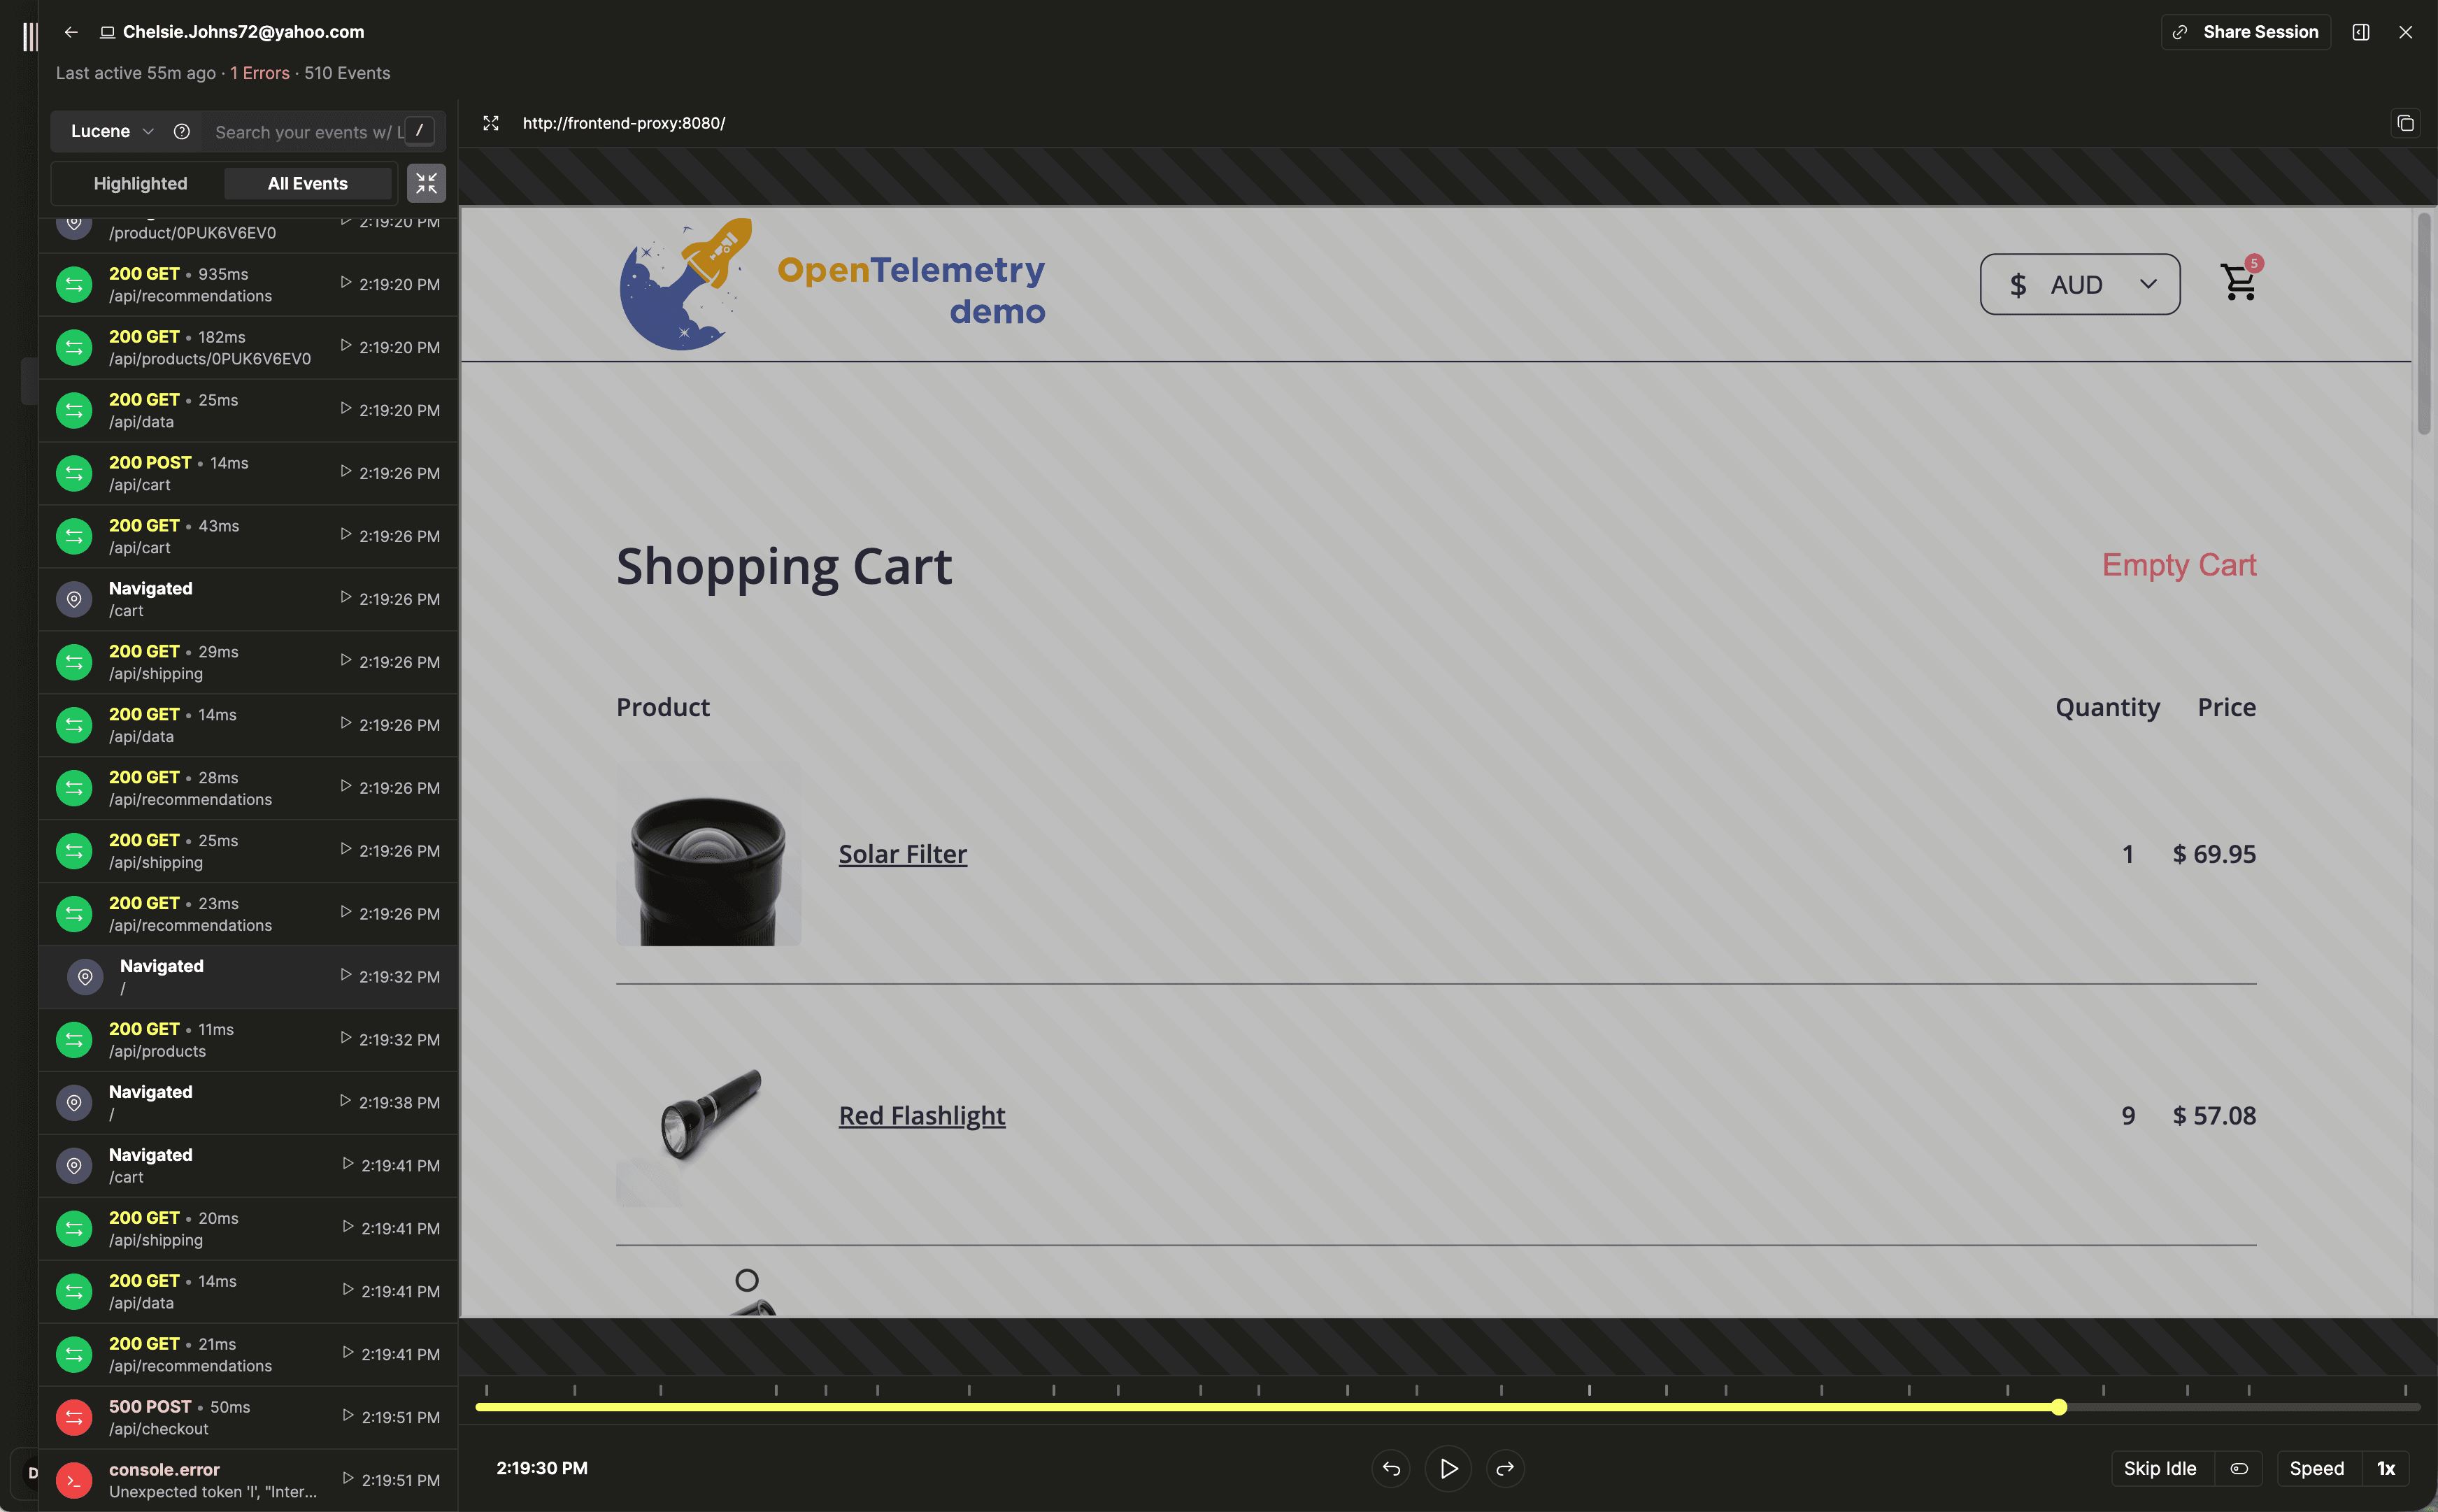
Unlike Splunk, which connects logs in Splunk Cloud Platform or Enterprise with metrics and traces in Observability Cloud through Log Observer Connect, ClickHouse Observability unifies logs, metrics, traces, and session replays on one analytical engine.
SREs investigate through the ClickStack UI, while agents use MCP and SQL to explore the same telemetry. Both can connect a metric spike to failing requests, inspect related logs, and see the customer impact, with the context to follow a failure across services.
Give agents purpose-built MCP tools to search logs, follow traces, and analyze event patterns and deltas.
For deeper analysis, use ClickHouse SQL to join signals, compare deployments, and uncover historical trends. Agents can work with familiar SQL rather than depend on Splunk-specific SPL.
Save findings as searches, dashboards, and alerts your team can reuse.
Your agent in
Claude Code
Your agent in
Cursor
Your agent in
Codex
Your agent on
Your framework
Semantic tools
Findings saved as
Searches, dashboards, and alerts
Fast, concurrent queries let SREs and agents test deployments, dependencies, and historical behavior in parallel, using unsampled telemetry and longer retention to uncover patterns that short time windows miss.
Retained telemetry
Full history. No sampling.
Splunk Enterprise / Cloud Platform
Searchable telemetry
Optional archive: restored before search.
Explore possible causes in parallel, compare the evidence, and reach answers sooner.
ClickHouse Observability combines managed ingestion with the ClickHouse analytical engine. Compare its architecture, scalability, performance, and interoperability with Splunk Enterprise, Splunk Cloud Platform, and Splunk Observability Cloud.
Splunk Enterprise and Splunk Cloud Platform index events into time-based buckets on indexers, with search heads distributing each search and merging the results. Scheduled and ad hoc searches share that capacity. Splunk Observability Cloud adds separate services for metrics, traces, and real user monitoring.
ClickHouse Observability runs on ClickHouse Cloud, combining columnar compression, shared object storage, and independent compute for fast queries and affordable retention. Everything from ingestion to scaling is managed for you.
One ClickHouse engine and investigation UI for logs, metrics, traces, and session replays.
Fully columnar storage with type-specific compression codecs.
Managed OpenTelemetry endpoint, with ingestion and schema optimization handled for you.
Shared object storage with independently scaled compute, managed for you.
Separate ingestion and query compute over shared storage, managed for you.
Typed OpenTelemetry columns and native JSON with typed subcolumns, with schemas managed for you.
Parse and extract additional fields at query time using SQL.
Native text indexes alongside columnar storage.
Automatically created as required using materialized views, with incremental updates on insert.
Powered by open source ClickStack: ClickHouse, OpenTelemetry, and the ClickStack UI.
Native ClickHouse SQL, plus Lucene-style search in the ClickStack UI.
Fully managed observability on ClickHouse Cloud.
 Enterprise, Cloud Platform, Observability Cloud
Proprietary platforms, with open source OpenTelemetry collectors and SDKs.

Retain full-fidelity telemetry and historical context without sampling or roll-ups.

Give engineers and agents fast queries to test more hypotheses and reach answers sooner.

Use OpenTelemetry, familiar SQL, and your preferred agents through MCP.

Get straightforward volume-based pricing with ingestion, schemas, storage, optimization, and scaling managed for you.
Cut costs, accelerate investigations, and give SREs and agents the telemetry and history to resolve failures faster. Start with ClickHouse Observability and leave the platform to us.

Answers about ClickHouse Observability, migration from Splunk, and the options for your team.
ClickHouse Observability is a turnkey, fully managed observability solution for SREs and their agents. It brings logs, metrics, traces, and session replays together, with ingestion, schemas, storage, optimization, and scaling managed for you.
Compared with Splunk, its strengths are:
ClickStack is the open source foundation of ClickHouse Observability. You get the familiar ClickStack investigation experience, including search, trace waterfalls, dashboards, alerts, and MCP tools, with the underlying service managed for you.
You can also run open source ClickStack yourself. For teams with database expertise, ClickHouse Observability offers a self-managed experience with control over database configuration and optimization, while ClickHouse Cloud manages the infrastructure.
ClickHouse Observability is fully managed. We handle ingestion, schemas, the database, storage, and scaling. Just send telemetry to your managed OpenTelemetry endpoint, investigate in the ClickStack UI, or connect your agents through MCP. Pricing is volume-based: on the Scale plan, list prices are $0.20 per uncompressed GB for logs, traces, and session replays and $0.10 per million metric data points. The 50% beta discount reduces these to $0.10 per GB and $0.05 per million data points. Pricing details.
Self-managed ClickHouse Observability, formerly Managed ClickStack, gives you control over database configuration and capacity. You manage your collector, schemas, compute sizing and scaling, and read/write isolation using warehouse services, tuning the deployment as your workload changes. ClickHouse Cloud still operates the underlying infrastructure. You pay for compute and storage resources under standard ClickHouse Cloud pricing, rather than telemetry ingested.
Its columnar engine reads the columns a query needs, uses indexes to skip irrelevant data, and executes queries in parallel across CPU cores and replicas. Compression reduces storage requirements and the amount of data read during investigations.
This supports fast searches and aggregations across high-cardinality telemetry, including user IDs, trace IDs, and container IDs. SREs and agents can investigate detailed events and historical patterns without relying solely on predefined summaries.
Connect your preferred agents through MCP to search logs, follow traces, analyze event patterns and deltas, and create saved searches, dashboards, and alerts. SQL enables deeper analysis, including joins, historical comparisons, and trends.
Agents can investigate unsampled telemetry with long-term context, bringing production evidence alongside code and runbooks. AI Notebooks provide an integrated investigation experience for engineers who want to work with an agent inside the product.
Yes. ClickHouse Observability supports concurrent investigations and automatically scales query compute as demand grows. Query and ingestion workloads scale independently over shared storage, so additional query capacity does not require moving stored data.
Splunk Enterprise and Splunk Cloud Platform share search capacity across scheduled and ad hoc workloads. At concurrency limits, investigations can queue and scheduled searches can be skipped, potentially leaving gaps in alert evaluation or stale results in dashboards that rely on scheduled searches.
Yes. ClickHouse Observability combines compression, object storage, and caching to keep retained telemetry queryable without requiring sampling, roll-ups, or manual restoration from an archive. SREs and agents can compare current incidents with historical behavior using the original events.
Splunk SmartStore also retrieves searchable data automatically from object storage. However, data moved into frozen archives or Dynamic Data Active Archive must be restored before searching. ClickHouse Observability keeps data within your configured retention period directly queryable.
Yes. ClickHouse Observability connects these signals so you can move from an error in a log to the associated trace, inspect service behavior, and see the user's experience through session replay. Shared identifiers and instrumentation provide the links between signals.
OpenTelemetry metrics are supported. If your monitoring depends heavily on PromQL or specialized metrics workflows, include those requirements in your evaluation rather than assuming every existing workflow transfers unchanged.
The default experience uses volume-based pricing: logs, traces, and session replays are charged per uncompressed GB ingested, and metrics per million data points. The rates are $0.20 per GB for logs, traces, and session replays and $0.10 per million metric data points, with 50% off both during public beta. See pricing for full details.
Splunk's pricing varies by product and plan, with activity-based, ingest, workload, and entity-based models.
Savings depend on your telemetry volume, retention requirements, existing contract, and the workloads you move. ClickHouse's compression and efficient query execution reduce the infrastructure required to store and analyze telemetry, while the managed service removes database administration work.
Yes. Existing OpenTelemetry collectors can forward telemetry to the managed OTLP endpoint, allowing you to retain your instrumentation and introduce ClickHouse Observability alongside your current platform. MCP-compatible agents can connect through the ClickStack MCP server.
For direct access from Grafana, BI tools, or database drivers, use the self-managed experience. That option also supports querying external databases and data lakes through ClickHouse SQL.
Start with a specific workload, such as application logs or distributed traces. Where your collection pipeline supports it, send telemetry to both platforms and validate data completeness, searches, dashboards, alerts, and performance before moving production investigations.
SPL searches, dashboards, and alerts need to be translated and tested; they do not transfer automatically. You can migrate gradually, keep historical data in Splunk initially, and expand once the new workflows meet your requirements. Parallel migration with OpenTelemetry.
ClickHouse Observability focuses on production observability and investigations for SREs and agents. It is not a direct replacement for every Splunk security, compliance, or specialist monitoring capability.


