 50.8k
During this past Black Friday and Cyber Monday, a minute of downtime can cost our merchants $5.1 million. That's why observability is critical, we need to detect issues and prevent any downtime. We saw around a 16x improvement out of the box with ClickHouse once we had it deployed, and at peak performance over 30x. And for us, less compute is money.
- ClickStack
Open source observability for SREs and their agents
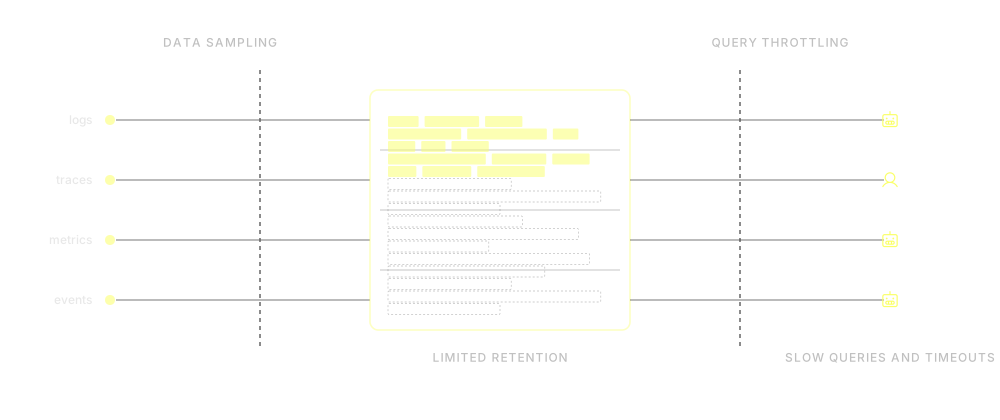
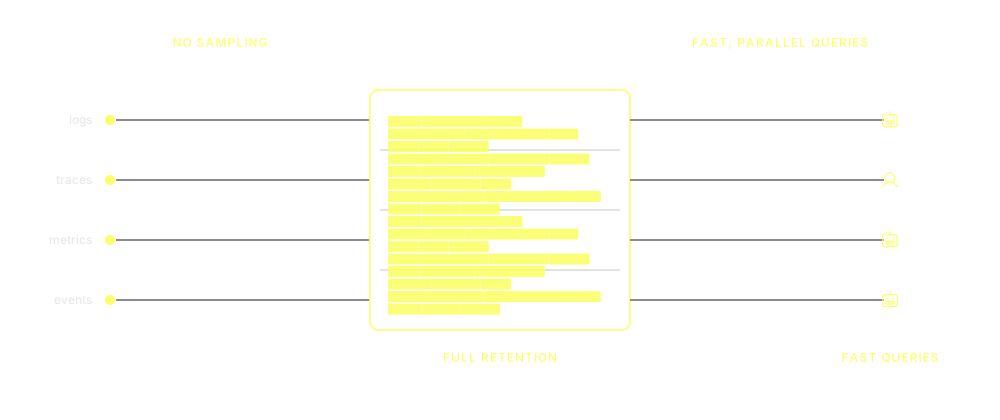
Built for OpenTelemetry at scale, ClickStack combines fast queries over high-cardinality data with low-cost, long-term retention so you can keep every log, metric, and trace without sampling or roll-ups.
This removes blind spots for SREs and unlocks agent investigations through MCP and SQL, giving both the full-fidelity telemetry and historical context to explore possible causes in parallel and reach root cause.
Trusted for observability by





ClickHouse played an instrumental role in helping us develop and ship Claude models. With ClickHouse, our database is green, queries are lightning-fast, and money is no longer on fire. It’s already delivered tremendous value in helping us build state-of-the-art language models.
Three layers. One open observability stack.
OpenTelemetry collects your signals, ClickHouse stores and queries them, and the ClickStack UI brings investigations together for your team.


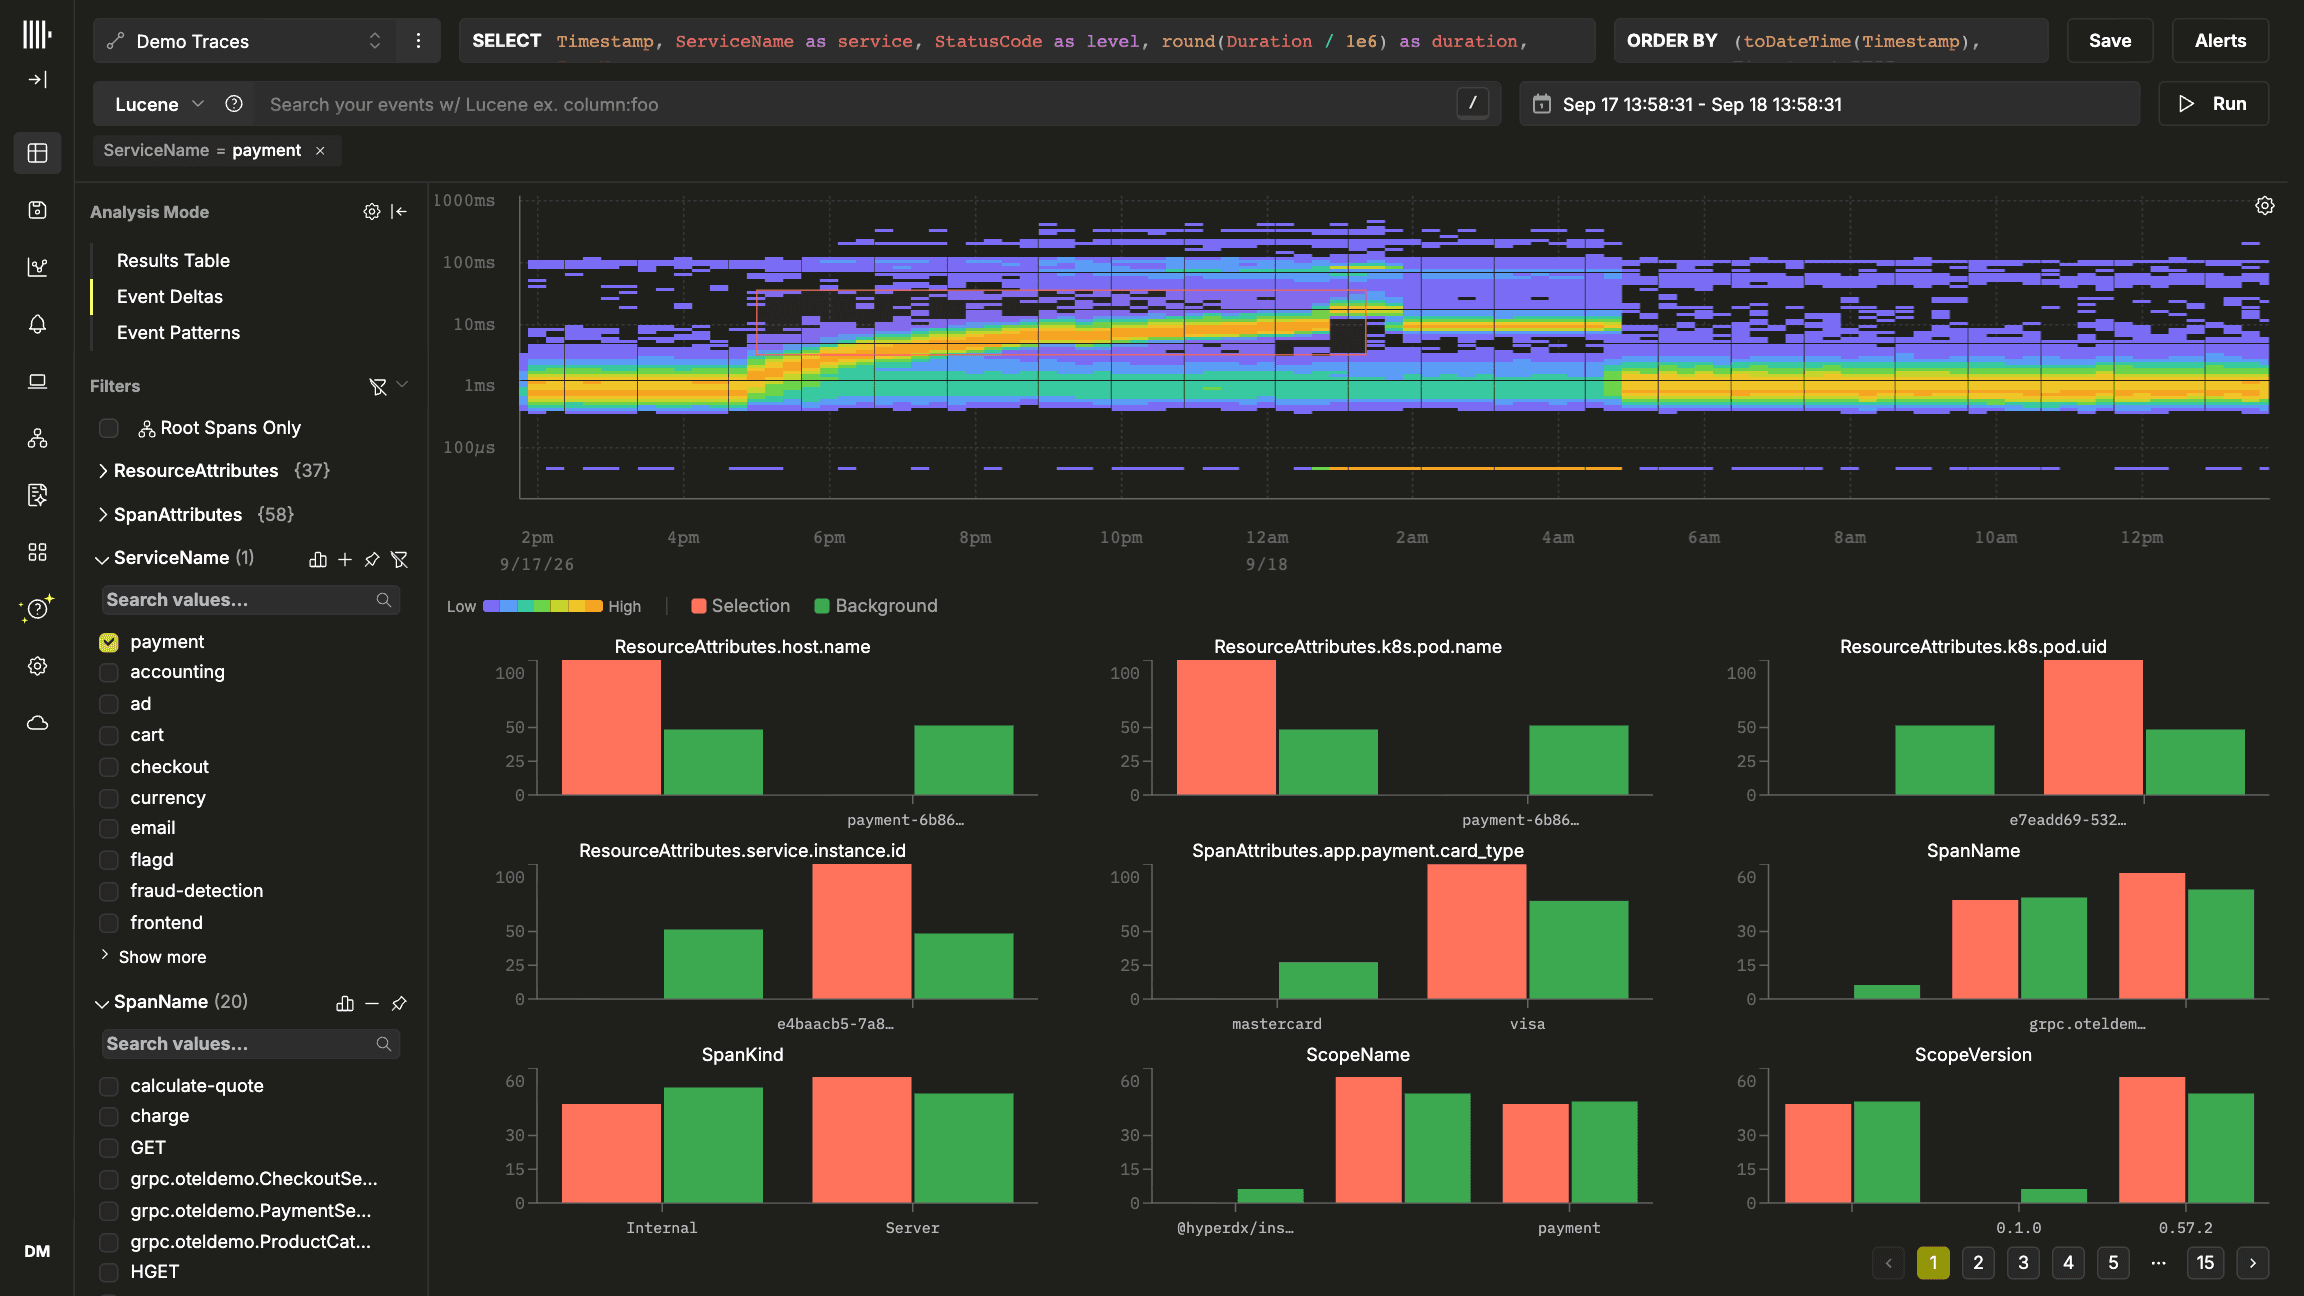
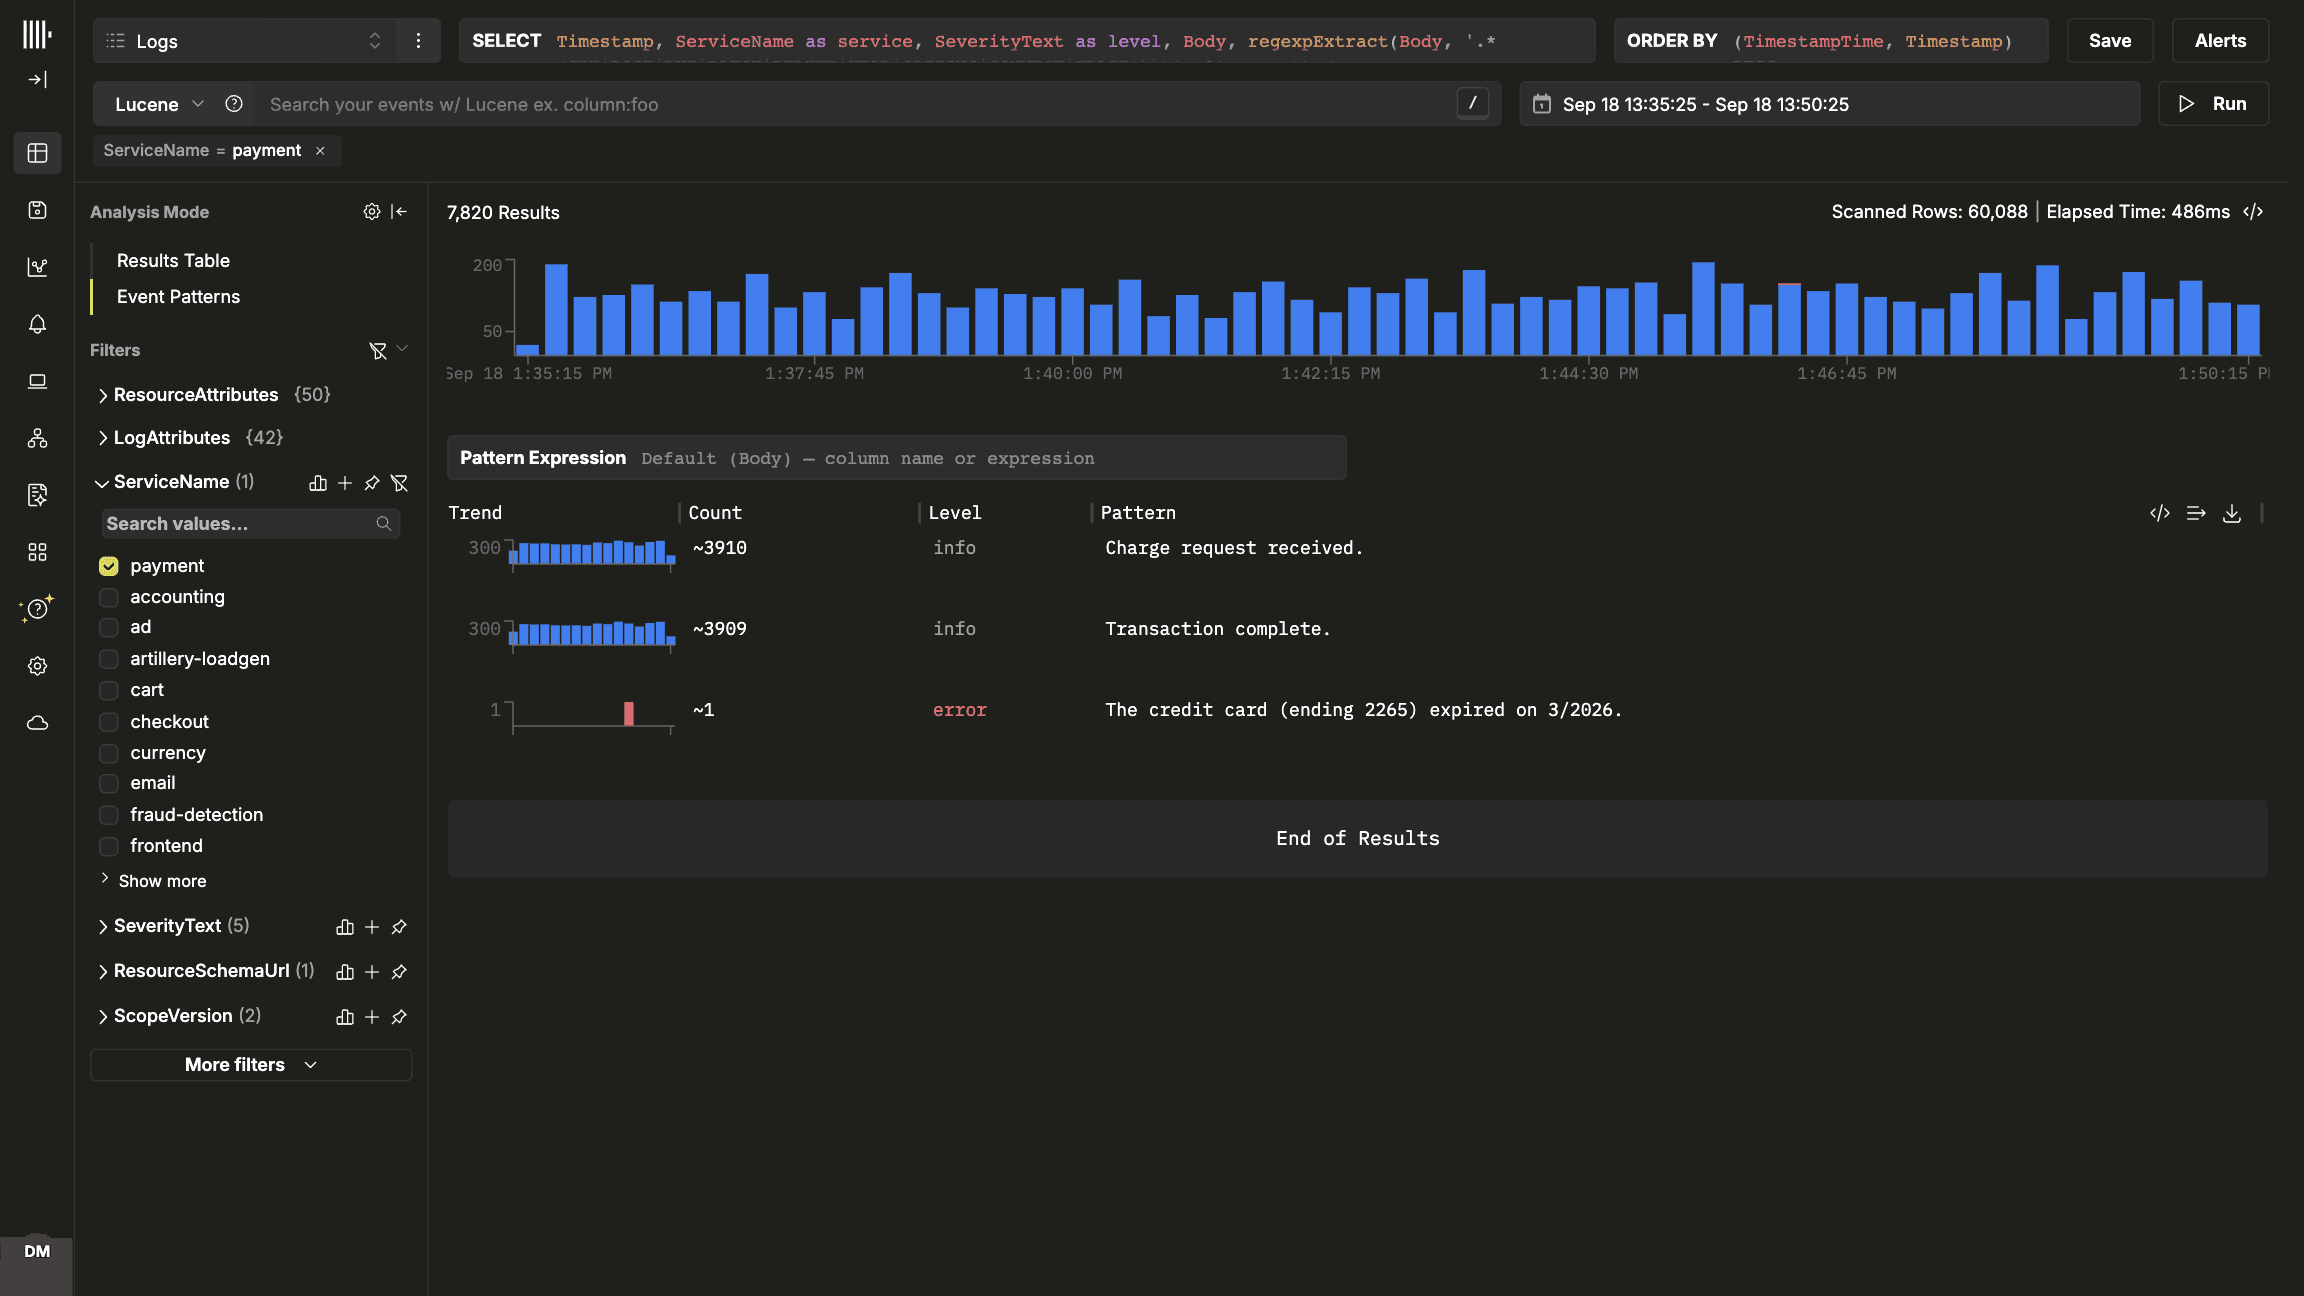
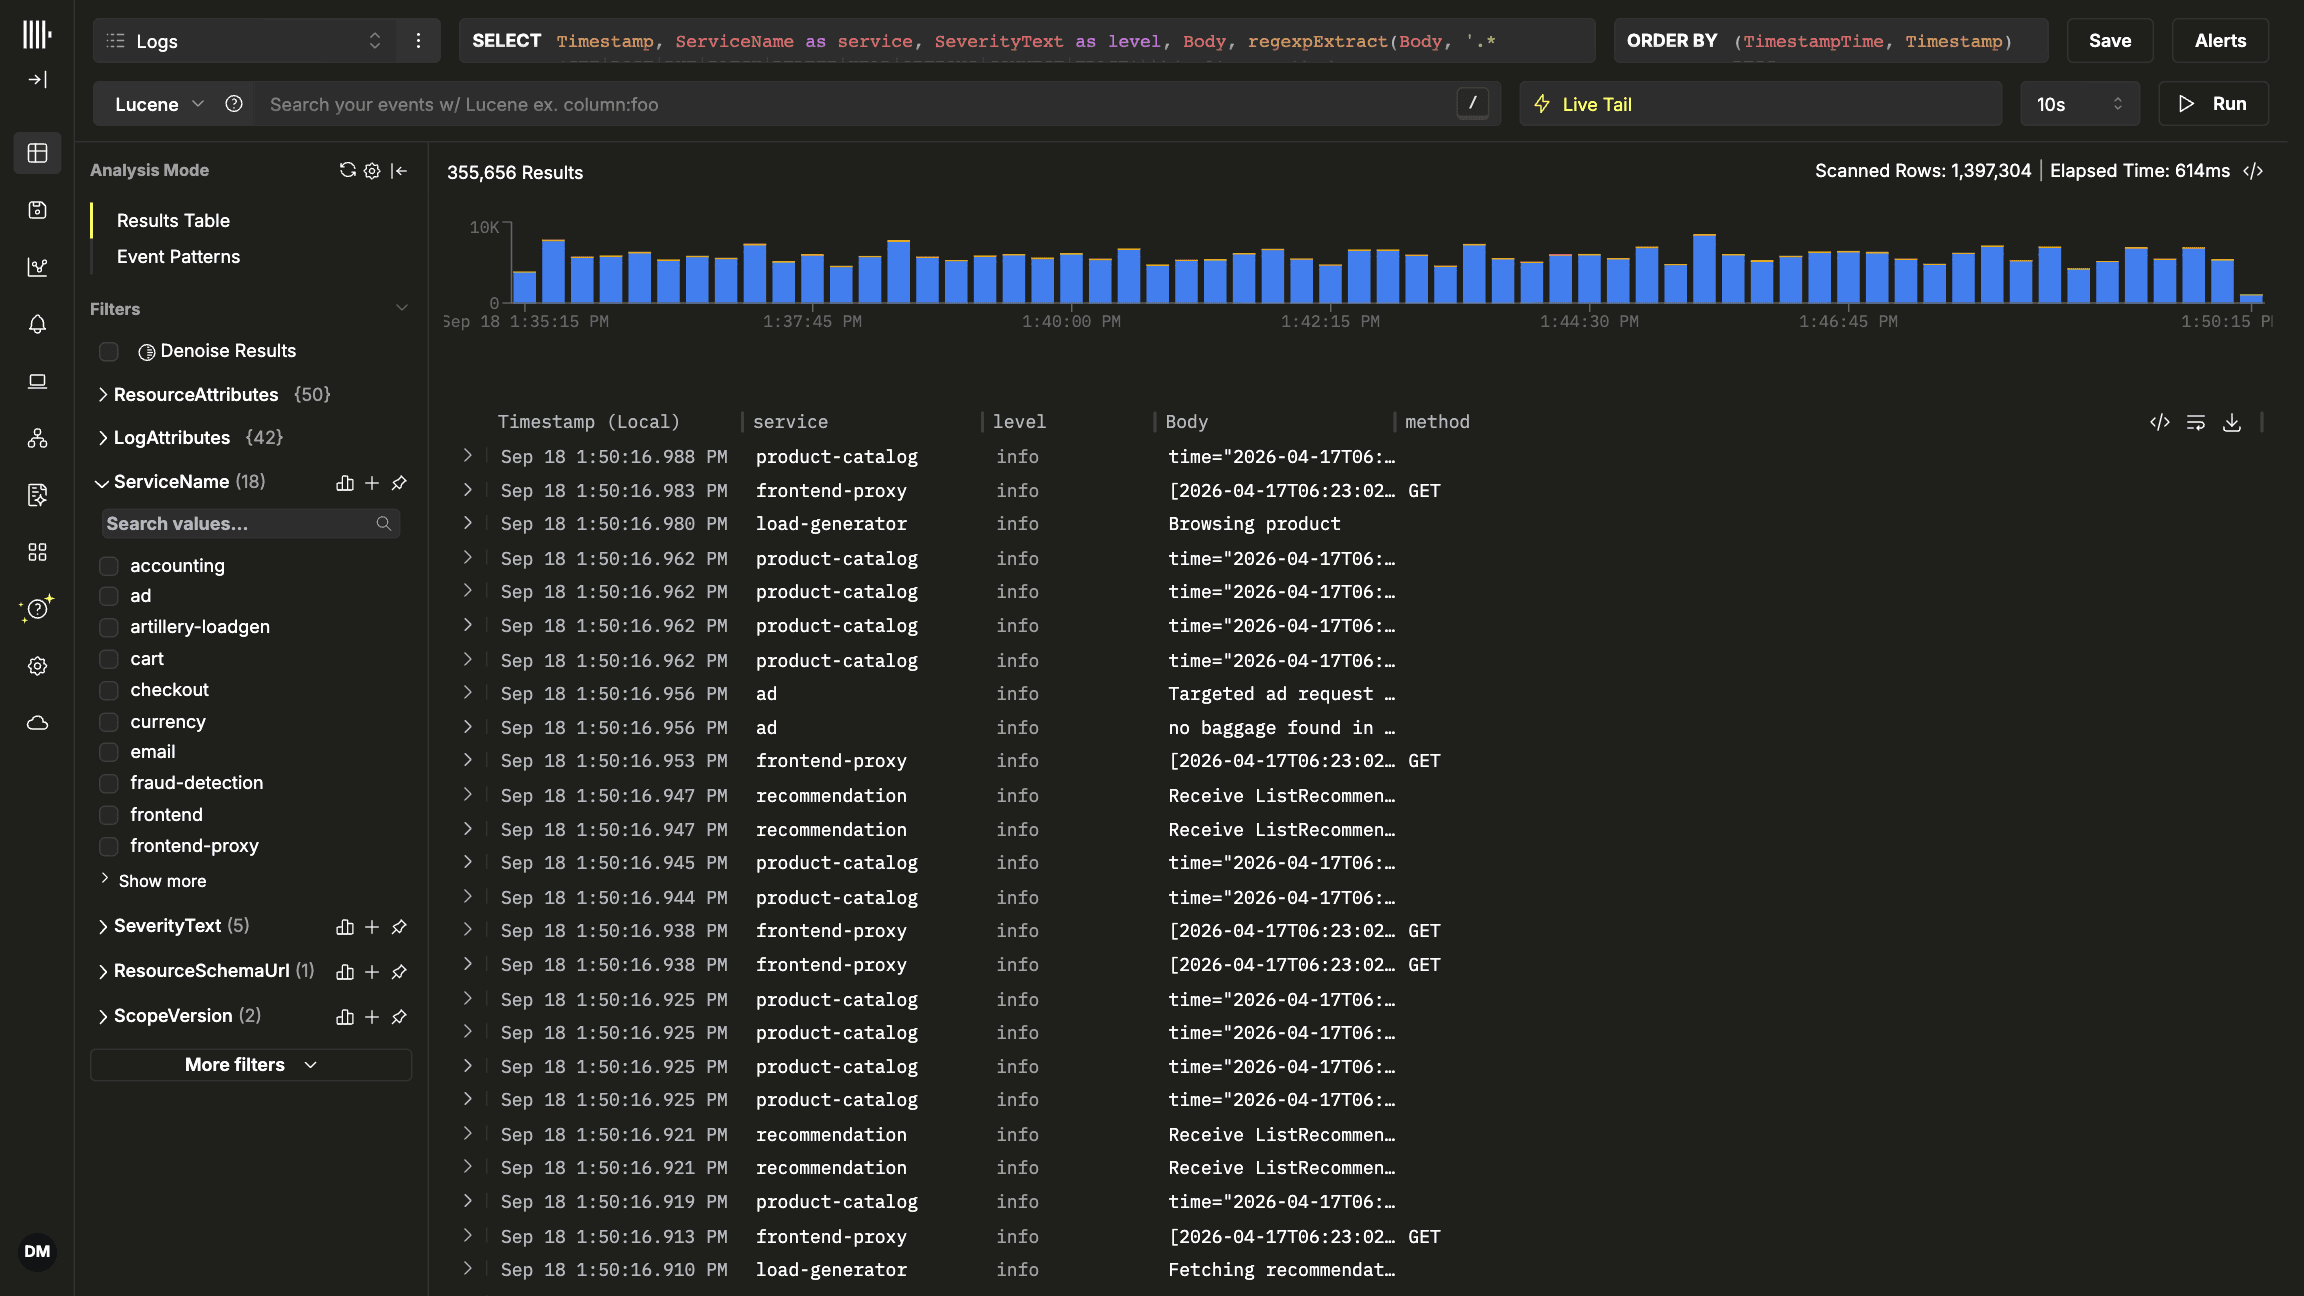
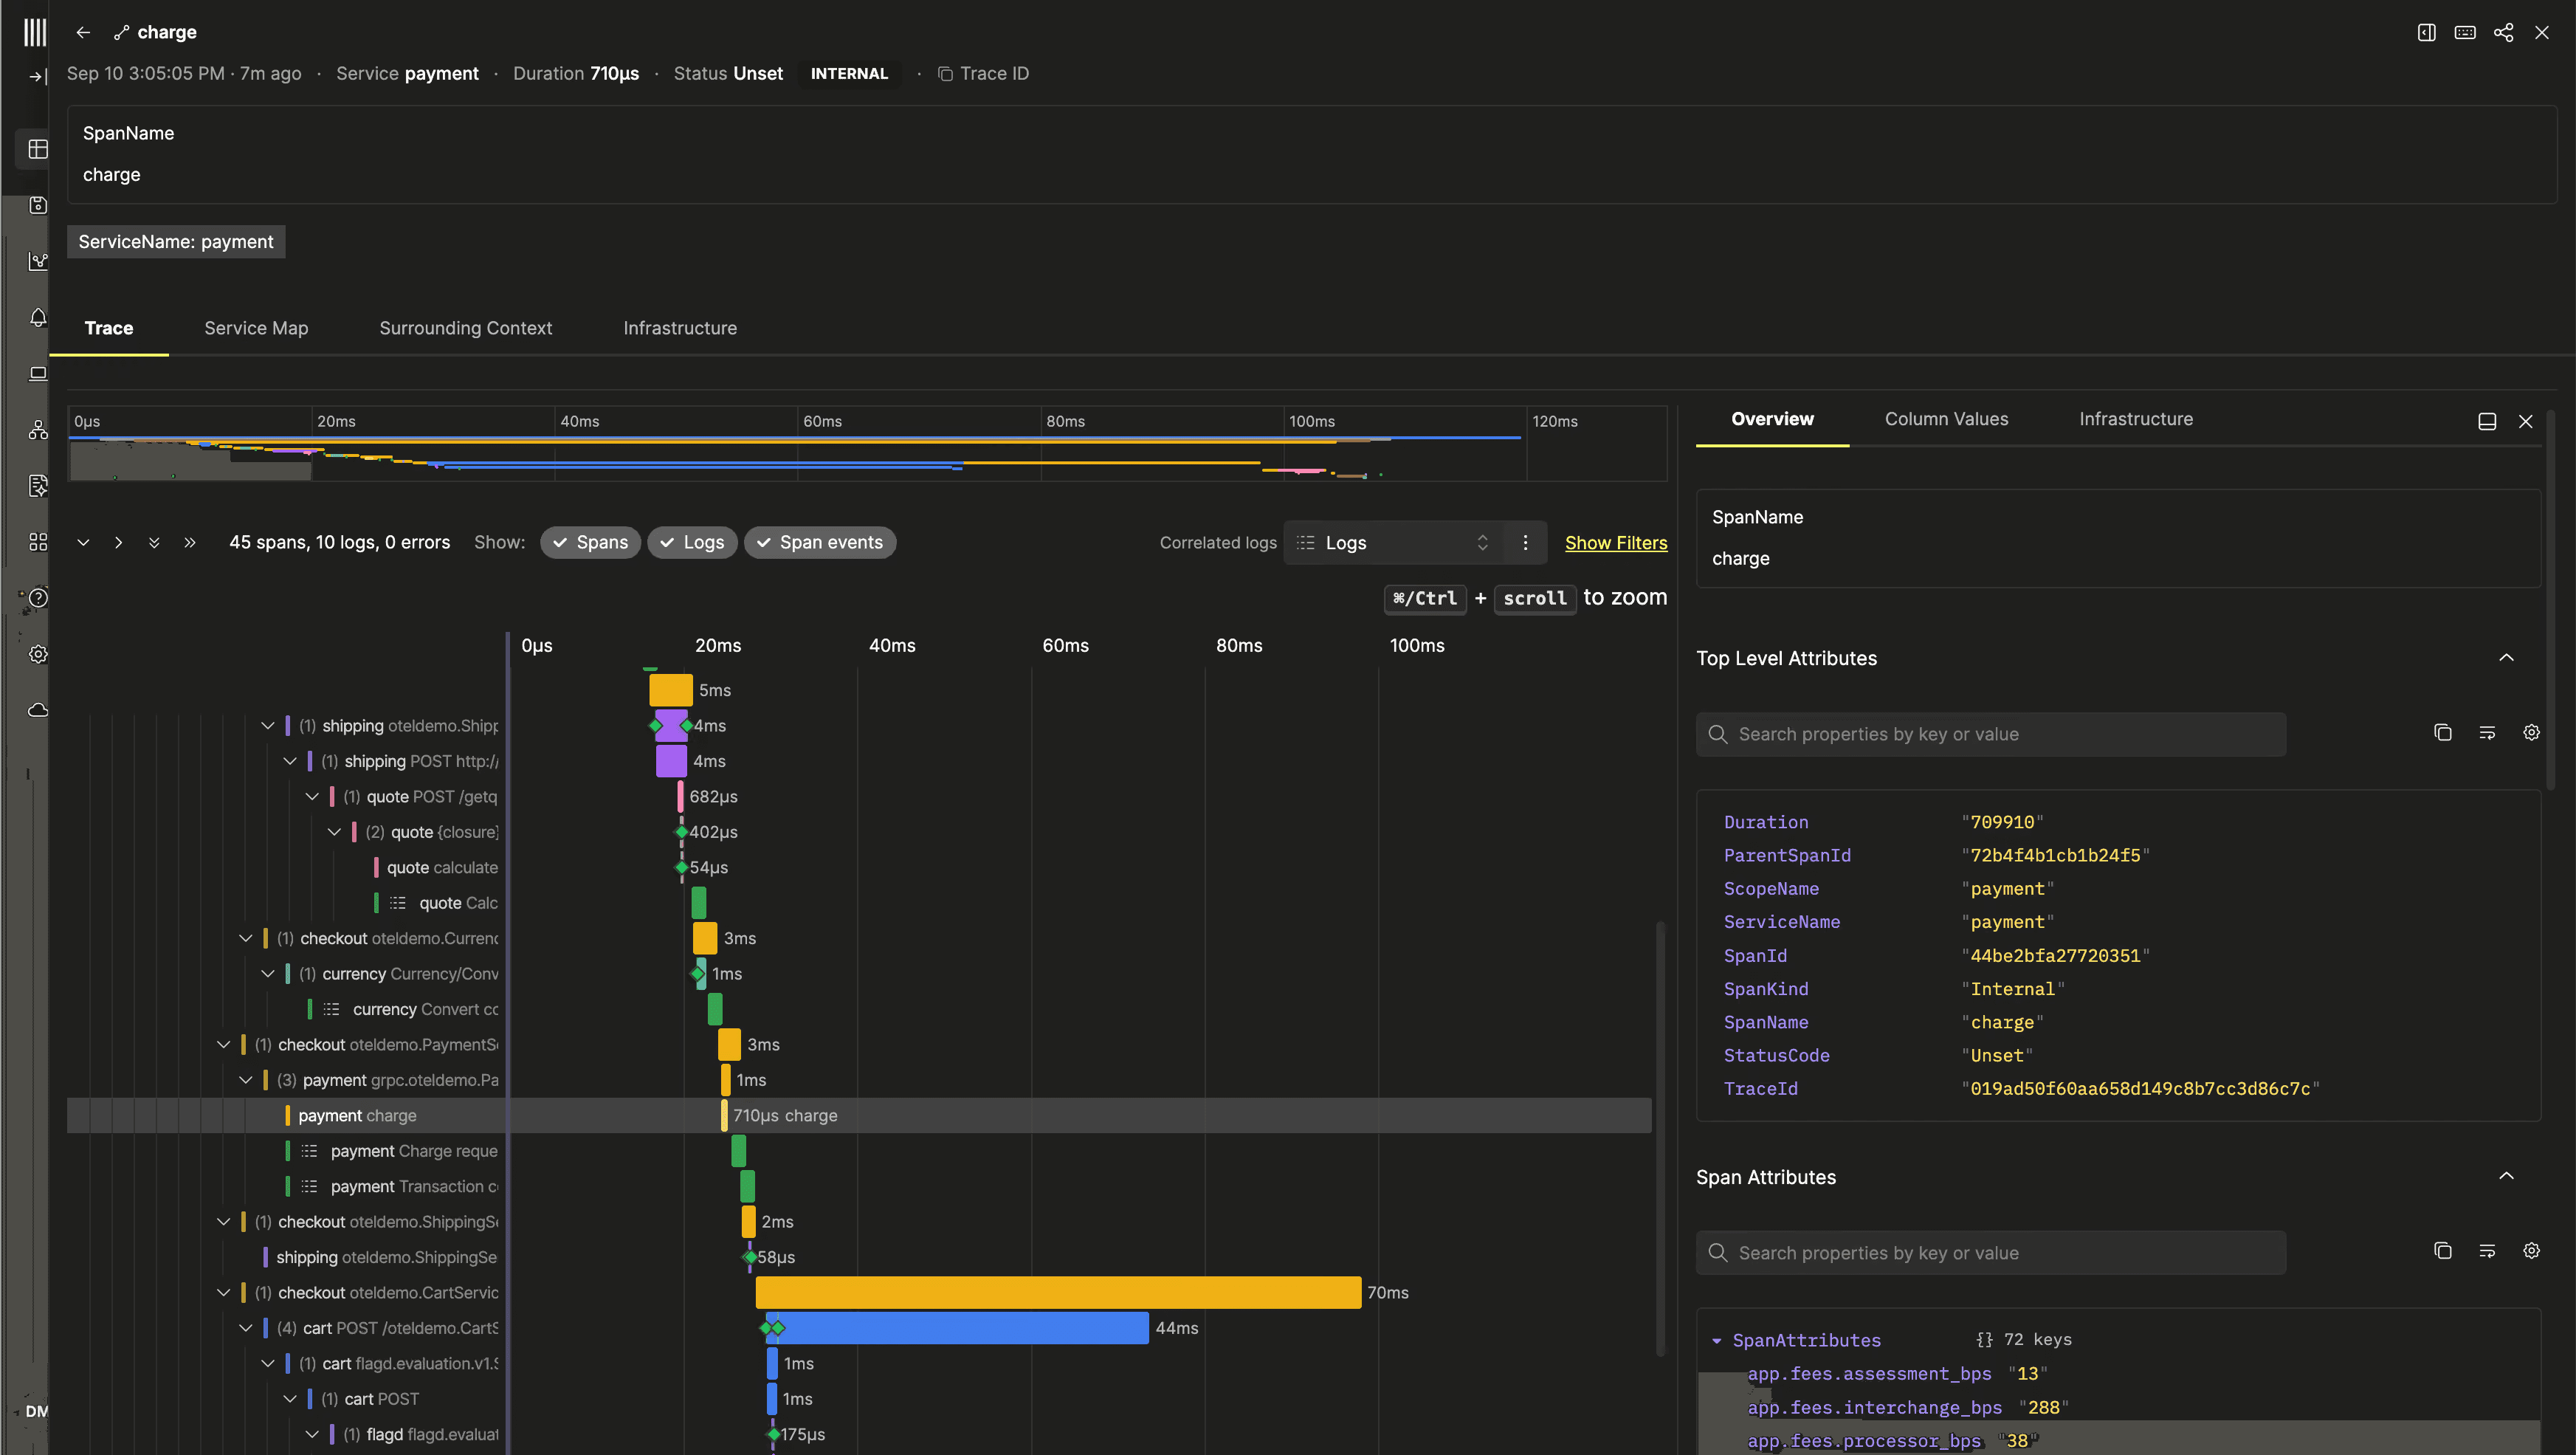
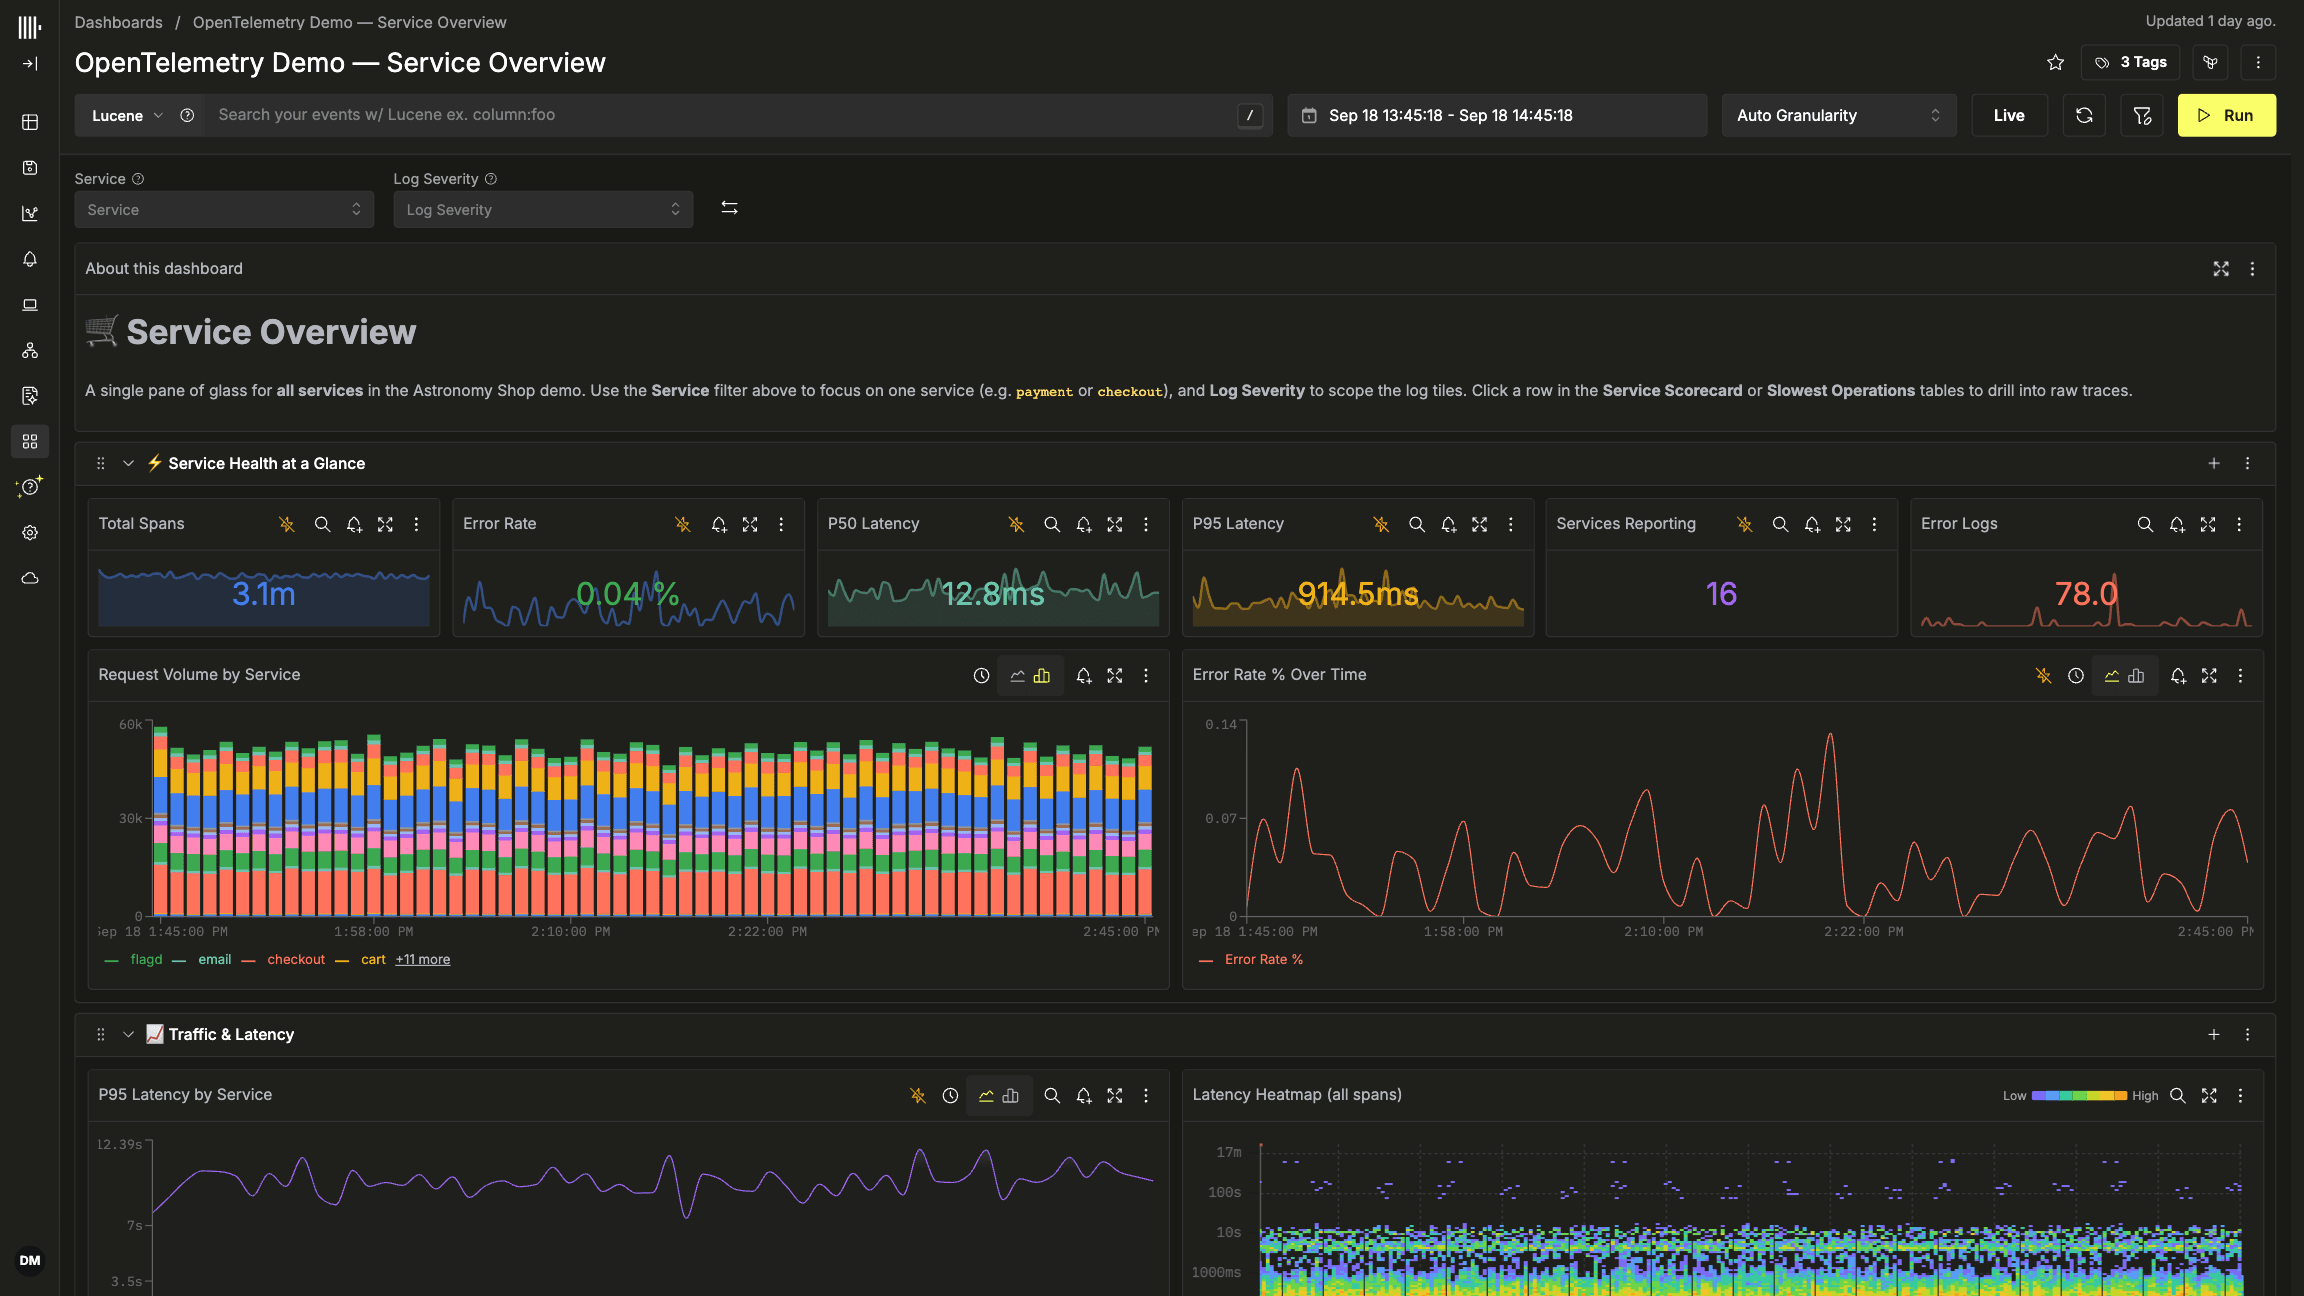
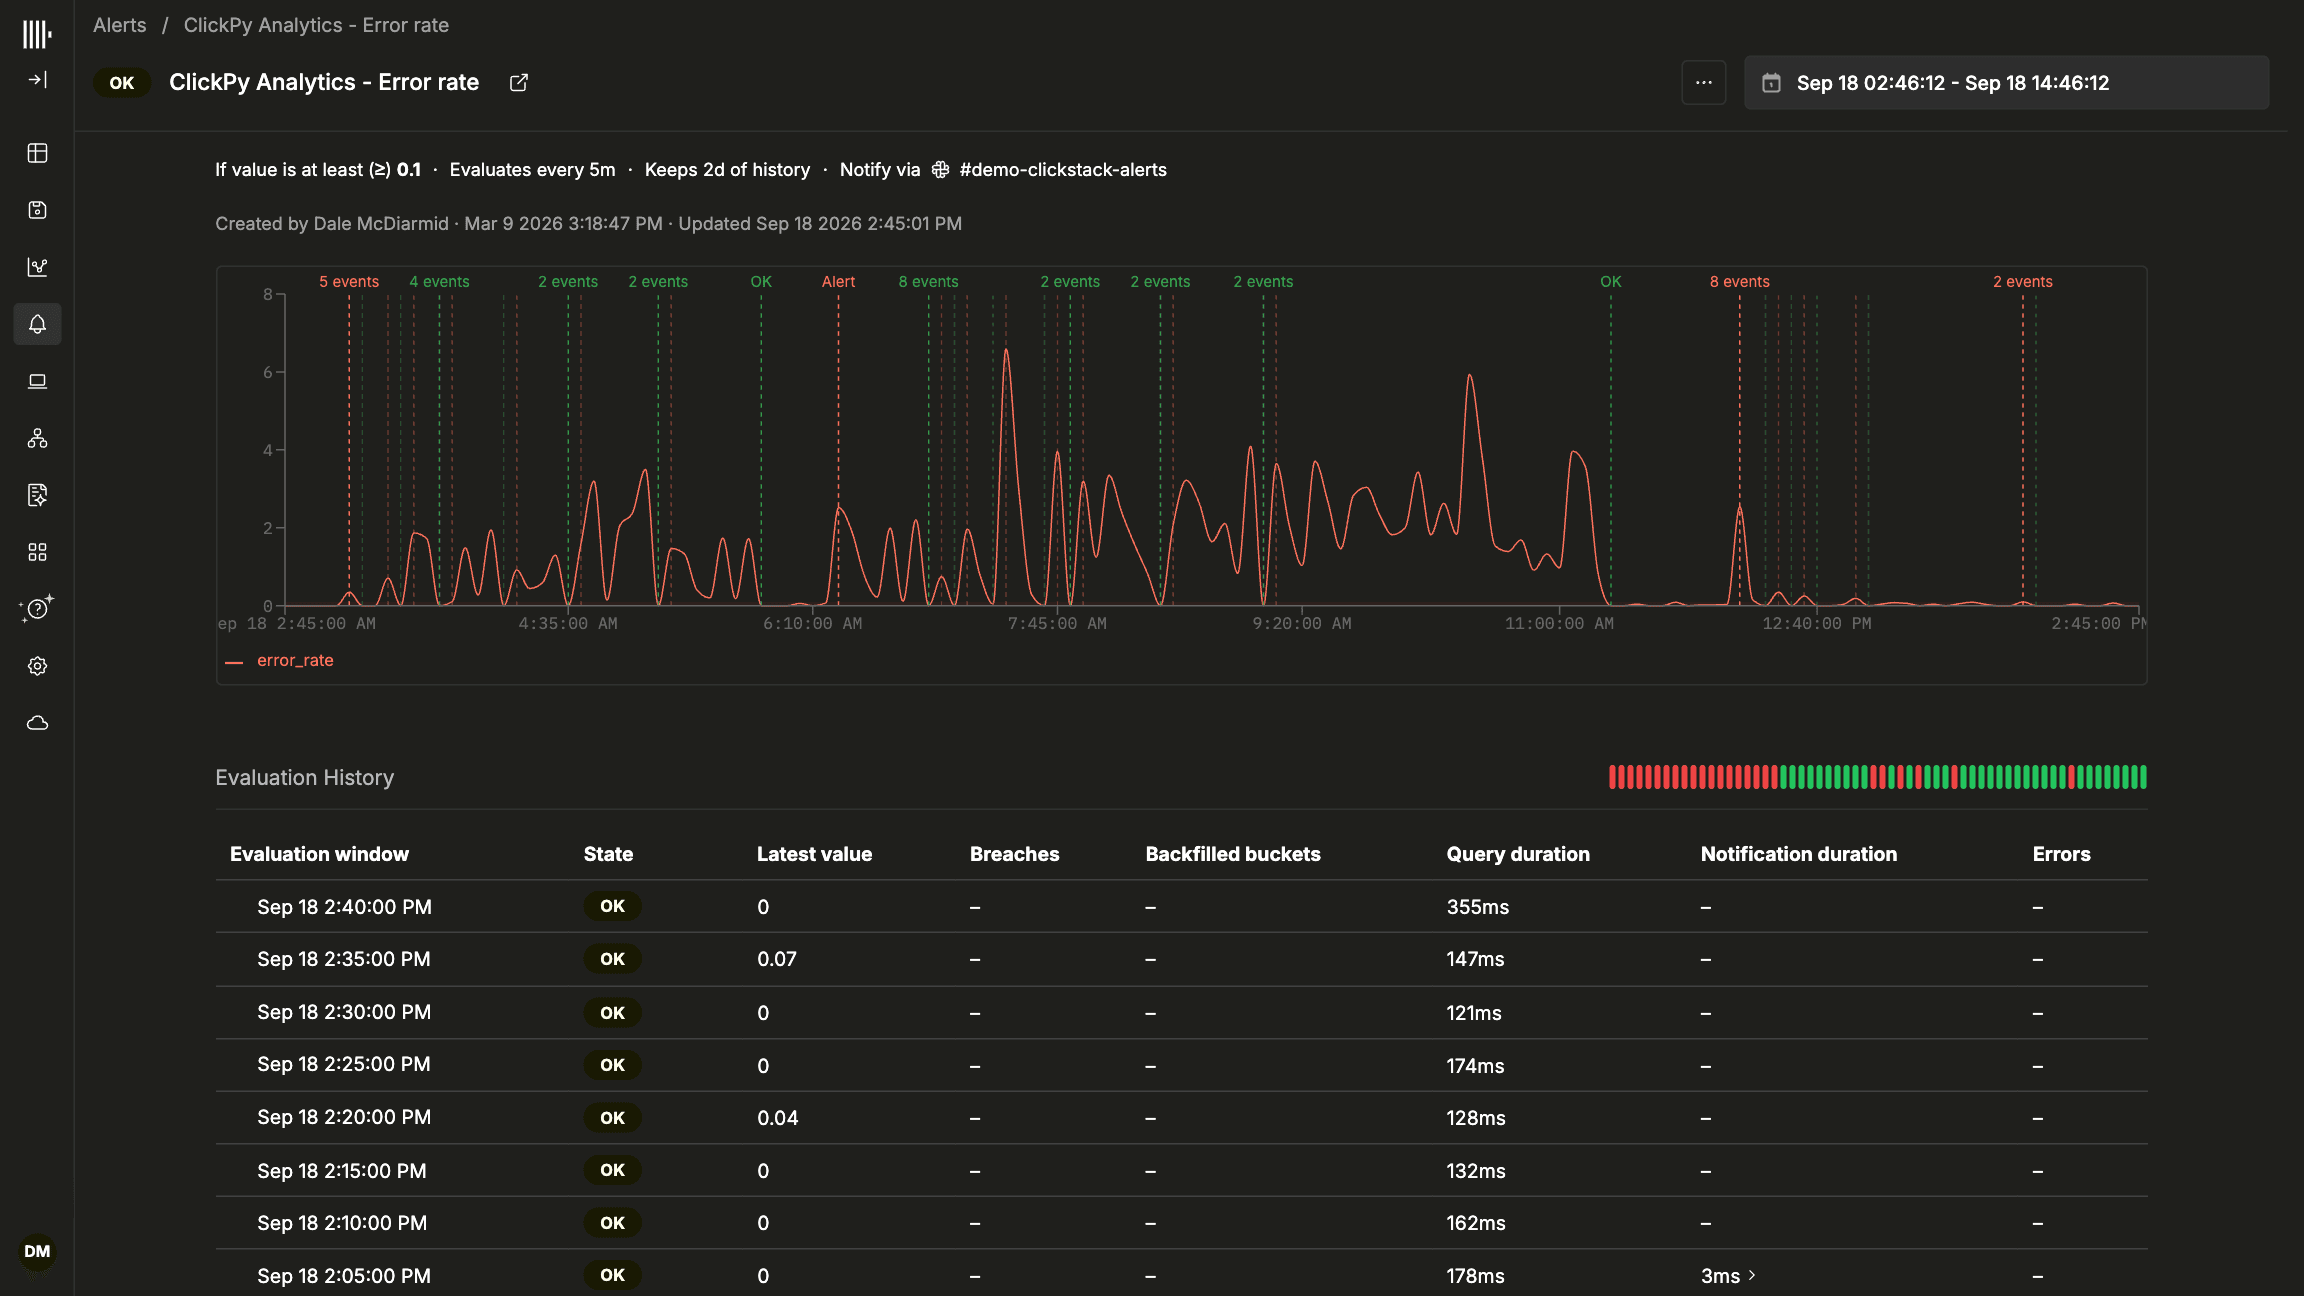
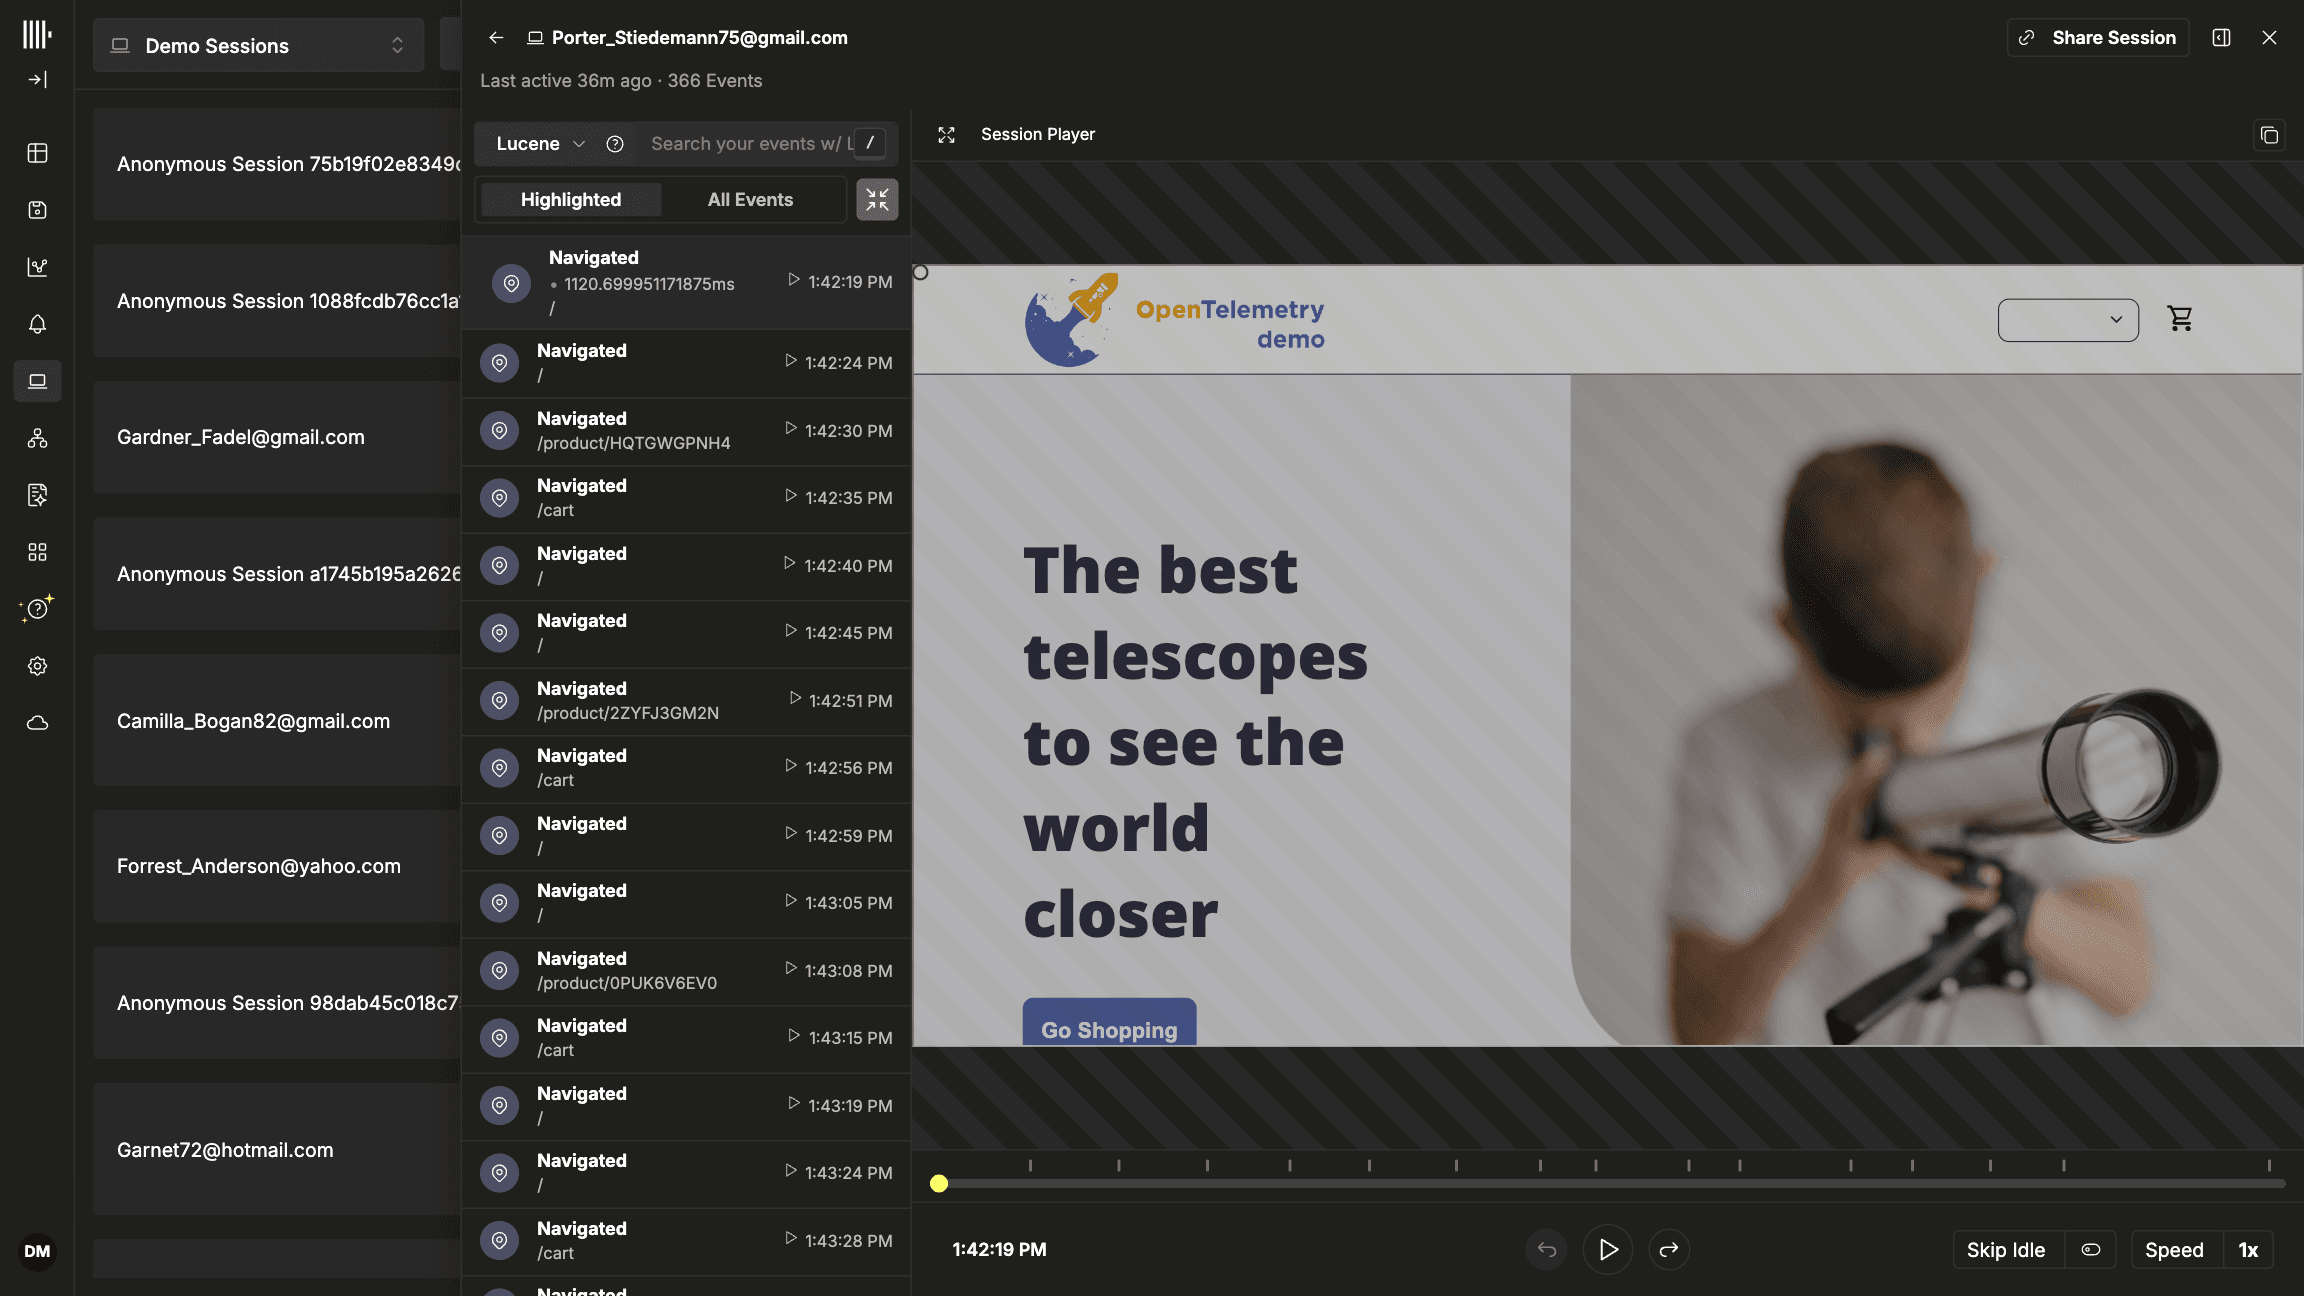
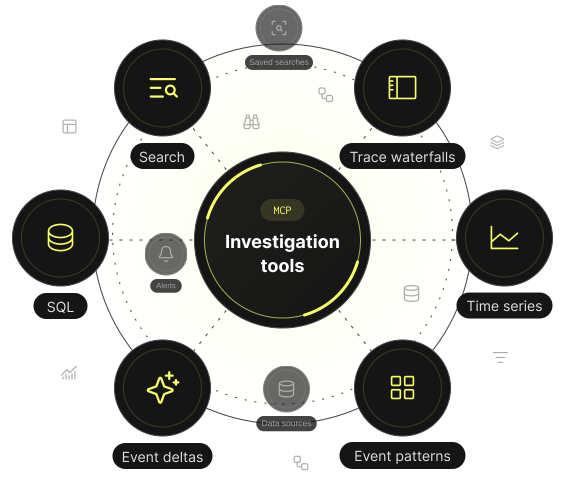
The ClickStack UI brings together search, trace waterfalls, event patterns, event deltas, dashboards, alerts, and session replays, with a built-in MCP server for your agents.
Combine high compression, fast search, and analytical SQL in one engine so SREs and their agents can investigate full-fidelity telemetry and long-term history at low cost.
Keep the high-cardinality detail inside every event, such as user IDs, request IDs, tenants, and deployment versions, so investigations can follow unexpected correlations without deciding every useful dimension in advance.
Use your existing instrumentation with a bundled OpenTelemetry Collector and schemas designed for logs, metrics, and traces, with the flexibility to adapt ingestion to your environment.
Run ClickStack locally. Start investigating.
Start with the all-in-one Docker image to try ClickStack on your own machine, with a bundled OpenTelemetry Collector and schemas.
-
Run the stack
Launch ClickStack with Docker and open the UI to create your local account. -
Send your first event
Copy your ingestion API key and send a test event through the bundled Collector. -
Explore your telemetry
Find the event in search, then connect your application or explore sample data.
Follow the deployment and production guides when you’re ready to run ClickStack for your team.
Bring your own schema
ClickStack is OpenTelemetry-first, but not OpenTelemetry-exclusive. Store logs, traces, and metrics in ClickHouse using your own schemas and pipelines, then explore your timestamped data through the schema-flexible ClickStack UI.
Lower observability costs. Keep more telemetry.
Reduce the storage and compute needed to run observability at scale, with control over how you configure and size your deployment.

10-30x OpenTelemetry compression
Best-in-class ingestion and compression rates for OTel data.

Store more in less space
ClickHouse columnar compression reduces the disk space needed for your telemetry as ingestion volumes grow.

Get more from your compute
Efficient query execution supports more searches and aggregations with the compute resources you provision.

Optimize for your workload
Tune schemas, indexes, and retention policies, then size infrastructure to match your workload and budget.
Why SREs and their agents run on ClickStack
When an incident hits, engineers and agents need to follow the evidence across services, compare past behavior, and test possible causes.


No sampling
Find rare failures in unsampled logs, metrics, and traces, including the individual events that explain what happened.

Full retention
Compare an incident with earlier deployments and past behavior to distinguish a new regression from a recurring failure.

Fast, parallel queries
Test multiple hypotheses at once, so engineers and agents can investigate different possible causes without waiting on each other.

Expressive SQL
Correlate signals by user, request, or deployment with familiar SQL, then follow new questions beyond predefined workflows.
From the first signal to the root cause
Find the failing request, understand what changed, see who it affected, and keep what you learned. ClickStack connects each step of an investigation across your telemetry.
Search logs with Lucene-style syntax or SQL, then follow the request through its trace waterfall to see every span across services and locate the hop that failed or slowed down.
Your workflows. Your harness. Your agents.
Bring your own observability agents
Connect the agents you already use to your ClickStack deployment through MCP, combining telemetry with your code, runbooks, and operational context to investigate from your preferred tools.
- Your tools. Work from Claude Code, Codex, Cursor, OpenCode, or your own MCP-compatible agent framework.
- Your context. Bring telemetry into investigations alongside the code, runbooks, and internal tools your agents already use.
- Shared findings. Turn investigations into saved searches, dashboards, and alerts that your team can build on.
Your agent in
Claude Code
Your agent in
Cursor
Your agent in
AI Notebooks
ClickStack
Semantic tools
Search logsFollow tracesCompare eventsQuery metrics

Your agent in
Codex
Your agent on
Your framework
Your agent in
OpenCode
Give your agents tools built for investigation
The ClickStack MCP server provides purpose-built tools for common investigation steps, with access to ClickHouse SQL when a question needs deeper analysis.
You can also discover telemetry sources and identify time-consuming operations.
Each tool encodes a common investigation workflow and an optimized query, so agents spend fewer steps reconstructing how to ask and more on the evidence.
In our evaluations against a generic ClickHouse MCP server, agents using these tools were:
17% more accurate
25% fewer tool calls
2.7× more consistent
Looking for a fully managed solution?
Get the familiar ClickStack UI with ClickHouse Observability, our fully managed service for SREs and their agents.
Send your telemetry to one managed endpoint while ClickHouse handles ingestion, schemas, storage, optimization, scaling, backups, and upgrades.
ClickHouse Observability
Fully managedIngestion
OpenTelemetry endpoint
Investigation tools
Human interface
AI NotebooksDashboardsAlertsSearch
Agent interface
MCPCLIAPISemantic toolsSkills
Handled automatically
Schema optimization
Workload isolation
Auto-scaled compute
AI agent
Engineer
AI agent
SRE
Instrument your applications
Bring application logs, metrics, and traces into ClickStack with OpenTelemetry SDKs and collectors, giving your team and agents the context to investigate across your stack.


Start investigating with ClickStack
Give your SREs and agents full-fidelity telemetry, historical context, and fast SQL queries in an open source stack you control.

FAQs
Explore our FAQs to learn more about ClickStack, and if you don't see what you need, we're always happy to chat.
01
ClickStack is an open source observability stack for SREs and their agents, combining OpenTelemetry collection, ClickHouse storage and analytics, and the ClickStack UI for investigating logs, metrics, traces, and session replays.
02
Yes. ClickHouse and the OpenTelemetry Collector are licensed under Apache 2.0, and the ClickStack UI under the MIT license. You can inspect the code, run the stack on your own infrastructure, and customize its collection, storage, and investigation layers for your environment.
03
The three main layers are the OpenTelemetry Collector for ingestion, ClickHouse for storing and querying telemetry, and the ClickStack UI for investigation.
The standard open source deployment also uses MongoDB to store application settings such as dashboards, alerts, and user profiles.
04
No. Engineers can investigate through search, trace waterfalls, event patterns, event deltas, dashboards, and session replays, while agents and SQL provide additional ways to explore the same data.
05
Yes. ClickStack includes an MCP server that compatible agents can use to query telemetry, discover sources, and manage saved searches, dashboards, and alerts.
Connect your preferred tools or agent framework to your ClickStack deployment using the MCP setup guide.
06
No. OpenTelemetry is the default path, with a bundled Collector and schemas to help you get started, but the ClickStack UI also supports existing ClickHouse telemetry tables with appropriate field mappings.
07
Your team operates the database, UI, ingestion pipeline, and supporting services, including capacity planning, security, backups, upgrades, and performance tuning.
This gives you control over the deployment and requires engineering resources to operate it.
08
ClickStack is the open source project behind ClickHouse Observability, the managed service for SREs and their agents.
Choose ClickStack when you want to run and customize the stack yourself, or ClickHouse Observability when you want ClickHouse to operate the platform.
ClickHouse Observability also offers a self-managed option for experienced teams that want to tune database workloads while ClickHouse Cloud manages the underlying infrastructure.
09
Both combine data collection, storage, and an investigation interface, but ClickStack uses ClickHouse's columnar analytics engine to bring search, aggregations, and SQL analysis together over your telemetry.
The ClickStack UI supports Lucene-style search, alongside tools such as event patterns, event deltas, and trace waterfalls.
10
Yes. Search logs with Lucene-style syntax or SQL. The default OpenTelemetry logs schema includes text indexes, ClickHouse's inverted indexes, on log bodies and attributes, and ClickStack rewrites free-text searches to use them, so a search can skip data that can't match instead of reading every log body. Bloom filter indexes speed up lookups on high-cardinality columns such as trace IDs.
See the performance tuning guide to tune indexes for your workload, including on ClickHouse versions without text index support.
11
Use the open source quickstart to run ClickStack locally and explore sample data or send telemetry from an application, then follow the deployment and production guides when you are ready to operate it for your team.